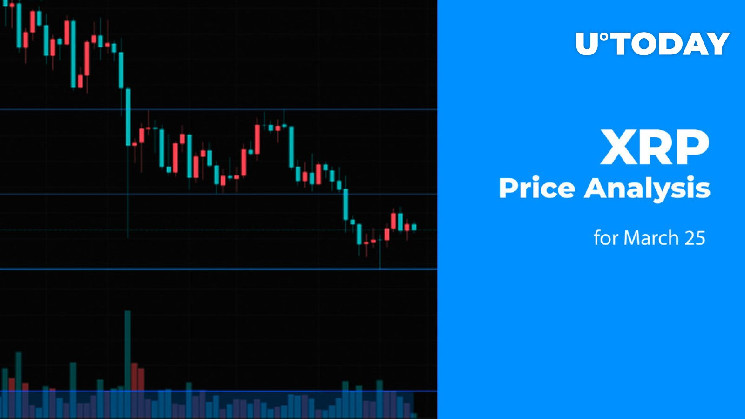
The cryptocurrency market is buzzing with activity as the prices of some coins are falling while others are rising. This is an indication that neither the bulls nor the bears have seized the initiative. One coin that has gained the most value among the top 10 coins is XRP, which has rocketed by 3.45%. In this article, we will conduct a detailed XRP price analysis for March 25.
On the local chart, the price of XRP has set the resistance at $0.4496. From a technical standpoint, sharp moves are unlikely today as most of the ATR has been passed. Accordingly, sideways trading in the area of $0.435-$0.44 is the more likely scenario until the end of the day.
On the daily timeframe, neither side has seized the initiative as the rate is far away from the key levels. One could only think about further growth if the price returns to the $0.48 mark and fixes above it. On the weekly chart, one should pay attention to the level at $0.4328. If the bar closes above it, there is a possibility of ongoing midterm growth to the $0.46-$0.48 zone.
Overall, XRP is trading at $0.4447 at press time. The XRP/USD chart by TradingView shows a steady uptrend over the last 24 hours, with the price increasing from $0.4301 to $0.4447. The trading volume has also seen a significant increase, indicating buyer interest in the coin.
The XRP/USD chart by TradingView shows that XRP is currently in a bullish channel. The price has been trading inside this channel since the start of March, and we can see that it has followed the support and resistance levels quite accurately. The current resistance level is at $0.4560, and the support level is at $0.4350. If the price manages to break through the resistance level, we might see XRP reach the $0.48 mark.
The Relative Strength Index (RSI) on the XRP/USD chart by TradingView is currently at 57. This indicates that XRP is in a bullish territory, but it is not yet overbought. If the RSI goes above 70, we might see XRP enter overbought territory, and a correction might be on the cards.
In terms of market capitalization, XRP is currently ranked as the fourth-largest cryptocurrency, with a market cap of $19.85 billion. The trading volume over the last 24 hours is around $3.43 billion, indicating that XRP is still quite popular among traders.
Looking at the XRP/BTC chart by TradingView, we can see that XRP has been trading inside a descending channel for the last few weeks. However, it looks like it might be breaking out of the channel, as the price has crossed the resistance level at 0.00001200 BTC. The next resistance level is at 0.00001250 BTC, and if XRP manages to break through this level, we might see it reach 0.00001400 BTC.
The MACD indicator on the XRP/BTC chart by TradingView is currently giving a bullish signal, as the MACD line has crossed above the signal line. This indicates that the momentum is starting to shift in favor of the bulls.
In conclusion, XRP is currently in a bullish trend, and it looks like it might break through the resistance levels in the near term. If it manages to break through the resistance levels, we might see it reach the $0.48 mark. However, traders should keep an eye on the RSI, as it might enter overbought territory soon. As always, it’s important to conduct thorough research and analysis before making any investment decisions.


