Bitcoin (BTC/USD) is one of the most popular cryptocurrencies in the world, and its value can be volatile in the market. In recent trading sessions, BTC/USD rose as high as the 28467.90 area after showing signs of buying pressure around the 28333.62 level.
However, selling pressure strengthened around the 28826.45 level, representing a test of the 78.6% retracement of the recent depreciating range from 29190.04 to 27512.97. At the end of March, BTC/USD absorbed the 28293.42 and 28344.24 levels, representing the 76.4% and 78.6% retracements of the same depreciating range.
BTC/USD appreciated approximately 19.9% in March and has gained about 71% year-to-date. Bulls are increasingly eyeing the 30127.80 area, an upside price objective associated with buying pressure around the 15460 and 19568.52 levels.
After the recent appreciation, upside price objectives include the 29244.66, 29639.37, 30127.80, 30275.12, 30763.09, and 31477.37 levels. Stronger long positions are eyeing price objectives around the 34658 and 35821 levels. Following the ongoing appreciation, retracement levels and areas of potential technical support include the 25948, 25756, 25358, 24253, 24099, 23789, 23147, 22605, and 22198 levels.
Below current price activity, downside price objectives include the 19266, 19132, 19106, 19006, 18981, 18919, 18822, 18116, 17720, 17523, 17457, 17230, and 17196 areas.
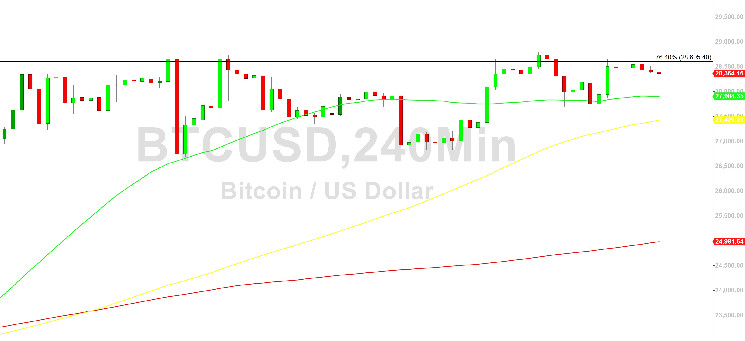
Traders are observing that the 50-bar MA (4-hourly) is bullishly indicating above the 100-bar MA (4-hourly) and above the 200-bar MA (4-hourly). Also, the 50-bar MA (hourly) is bullishly indicating above the 100-bar MA (hourly) and above the 200-bar MA (hourly).
Price activity is nearest the 50-bar MA (4-hourly) at 27904.83 and the 50-bar MA (Hourly) at 28282.49.
Technical support is expected around 25256.83/ 24224.60/ 21753.70 with stops expected below. Technical resistance is expected around 29244.66/ 29639.37/ 30127.80 with stops expected above.
On the 4-hourly chart, SlowK is bullishly above SlowD while MACD is bearishly below MACDAverage. On the 60-minute chart, SlowK is bearishly below SlowD while MACD is bearishly below MACDAverage.
Sally Ho’s Technical Analysis provided insightful and critical information regarding BTC/USD movements. This analysis should not be considered legal, tax, investment, or financial advice. This is third-party information provided for informational purposes only. The views expressed in this analysis are not the views of Crypto Daily. The BTC/USD market remains volatile, and technical analysis is necessary to determine potential buy and sell signals.