Current Market Status of Bitcoin
The market status of Bitcoin is being reviewed as of 4:15:32 p.m. UTC, 6 July 2023 based on real-time data. Specifically, this real-time data is sourced from Binance; one of the world’s leading cryptocurrency exchanges. According to this platform:
- Bitcoin in terms of the U.S. Dollar (BTC/USD) is trading at $30,405.3.
- There is an observed increase in price, specifically a jump of $50.0 representing a 0.16% increase.
- The volume of Bitcoins currently in circulation stands at 65,663 BTC.
- Both the bid price and the asking price are pegged at $30,405.3.
- There has been a trading range within the day noted between $29,888.0 and $31,500.0.
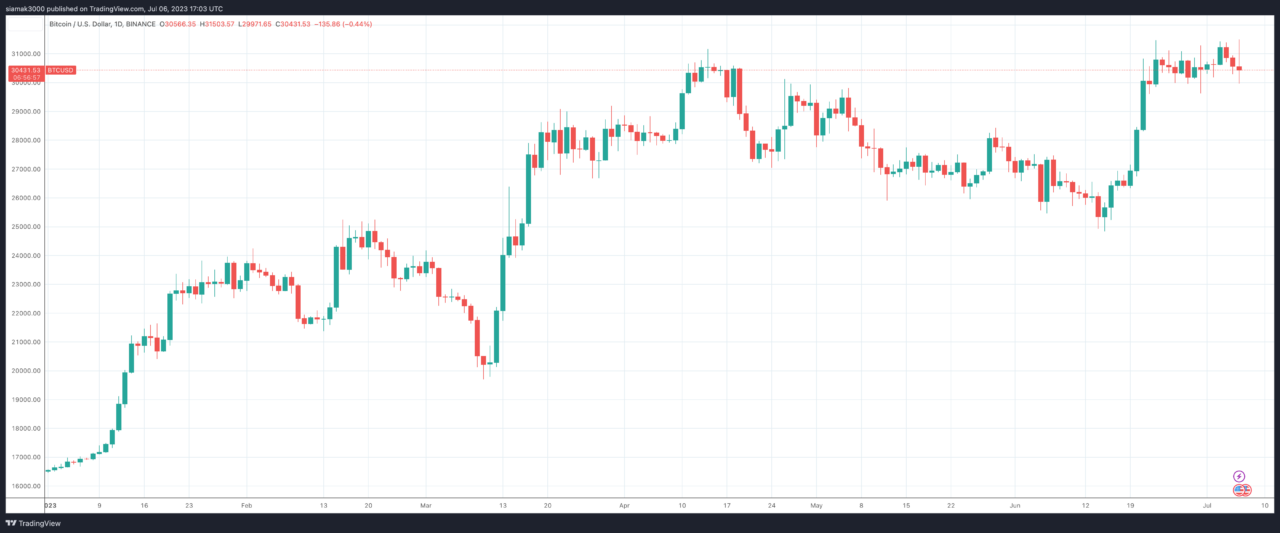
Source: TradingView
An Overview of Technical Indicators
Technical indicators are mathematical calculations that traders use to predict future price movements. They are handy tools for observing market behavior and comparing both current and historical performances. In this analysis, we’ll look at Bitcoin trading momentum and potential changes in price in the daily, weekly, and monthly context by focusing on the relevant technical indicators for each time period.
Daily Technical Indicators
The daily technical indicators give an instantaneous snapshot of Bitcoin’s trading momentum and project potential price changes over the course of a single day. Let’s delve deeper into the daily technical indicators of Bitcoin.
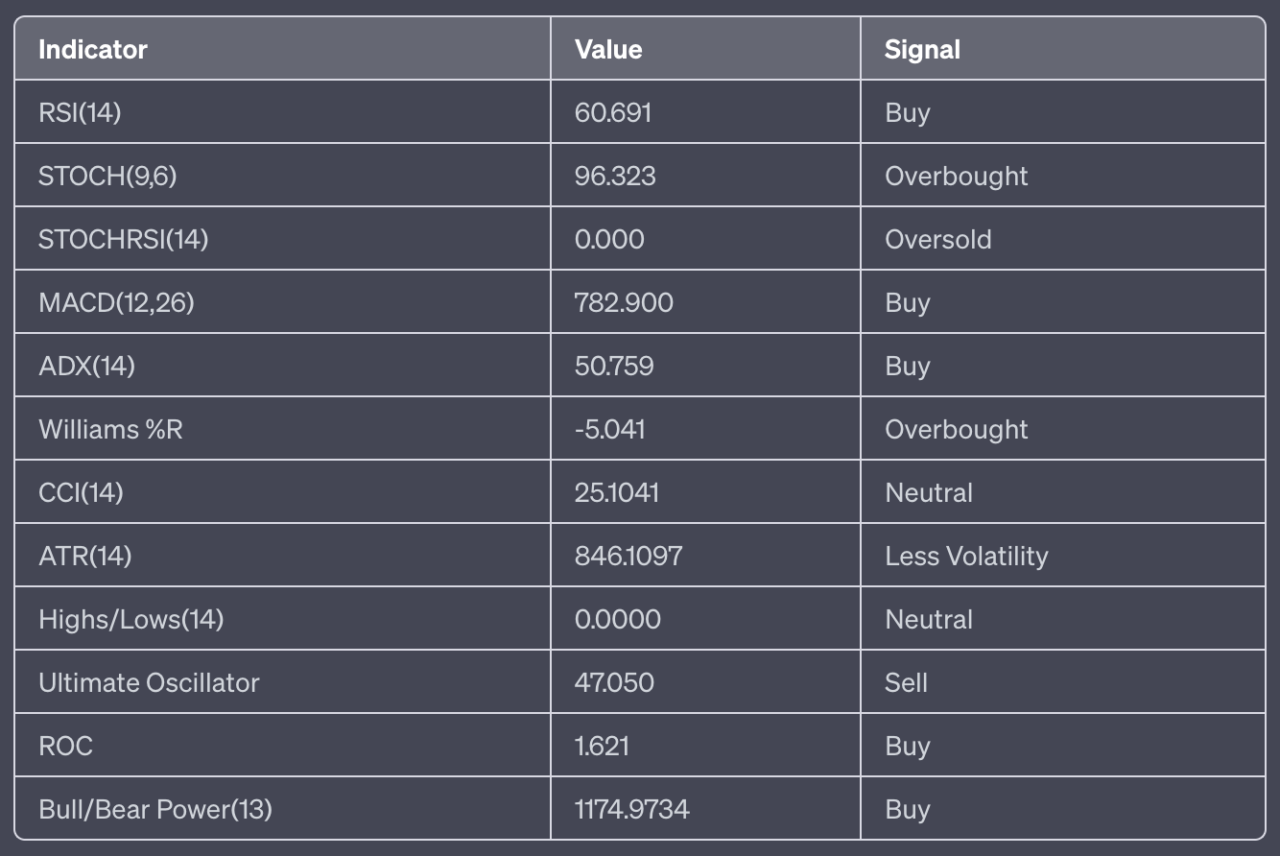
From the daily technical indicators, Bitcoin presents a “BUY” signal, as follows:
Both the RSI and MACD suggest a buy signal. This could mean that there is bullish momentum. However, the STOCH and Williams %R indicate that Bitcoin is currently overbought, which might suggest a potential price correction shortly.
Weekly Technical Indicators
Just like with daily indicators, weekly technical indicators offer traders a snapshot of Bitcoin’s trading momentum and the likely direction of price changes over a week. Now, let’s explore the weekly technical indicators for Bitcoin.
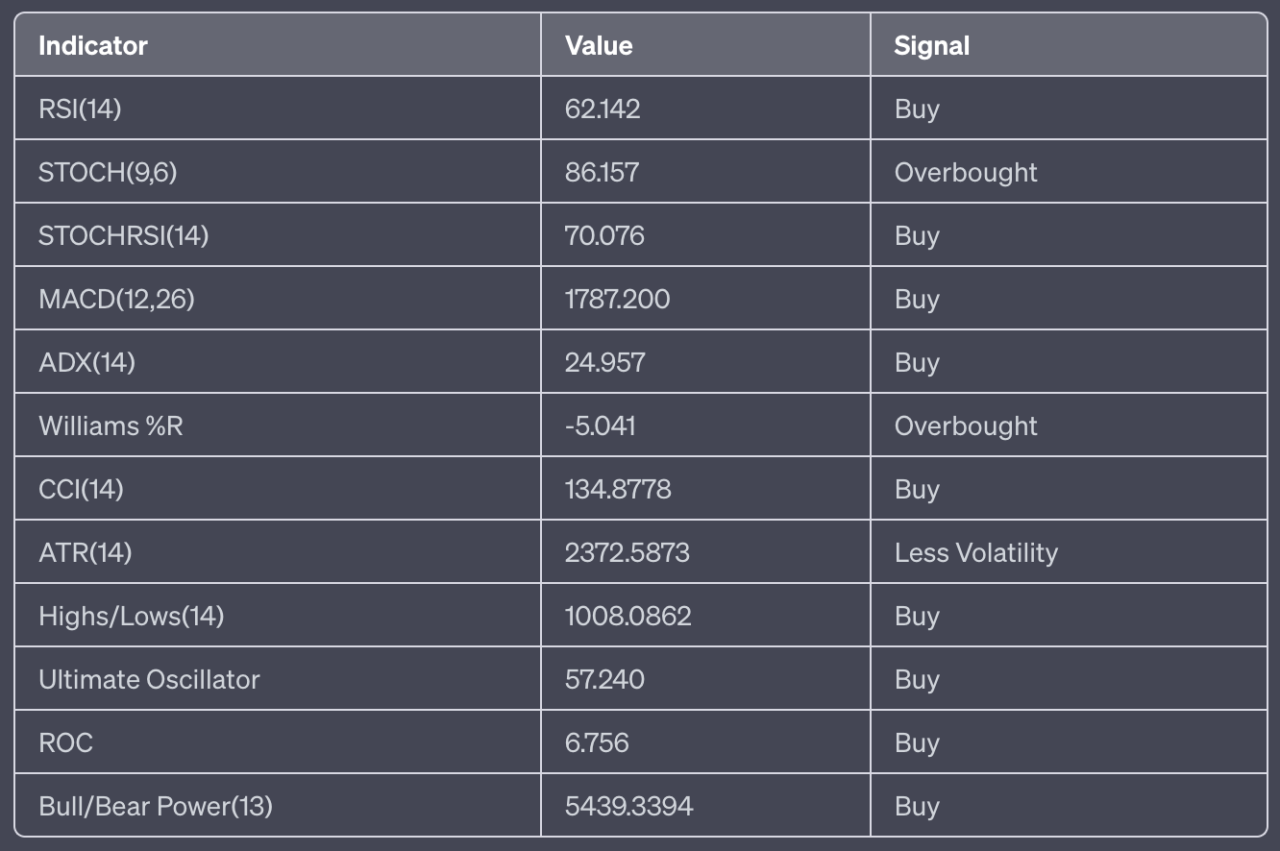
Guided by the weekly technical indicators, Bitcoin registers a “STRONG BUY” signal as summarized below:
- There are nine buy signals, and
- No sell signals surfaced.
The RSI, MACD, and CCI all suggest a buy signal, indicating bullish momentum just like in the daily indicators. Nonetheless, the STOCH and Williams %R show that Bitcoin is currently overbought, suggesting a potential price correction in the near future.
Monthly Technical Indicators
Last but not least, monthly technical indicators display an overview of Bitcoin’s trading momentum and potential price changes to be expected in a month. Now, let’s shine some light on monthly technical indicators for Bitcoin.
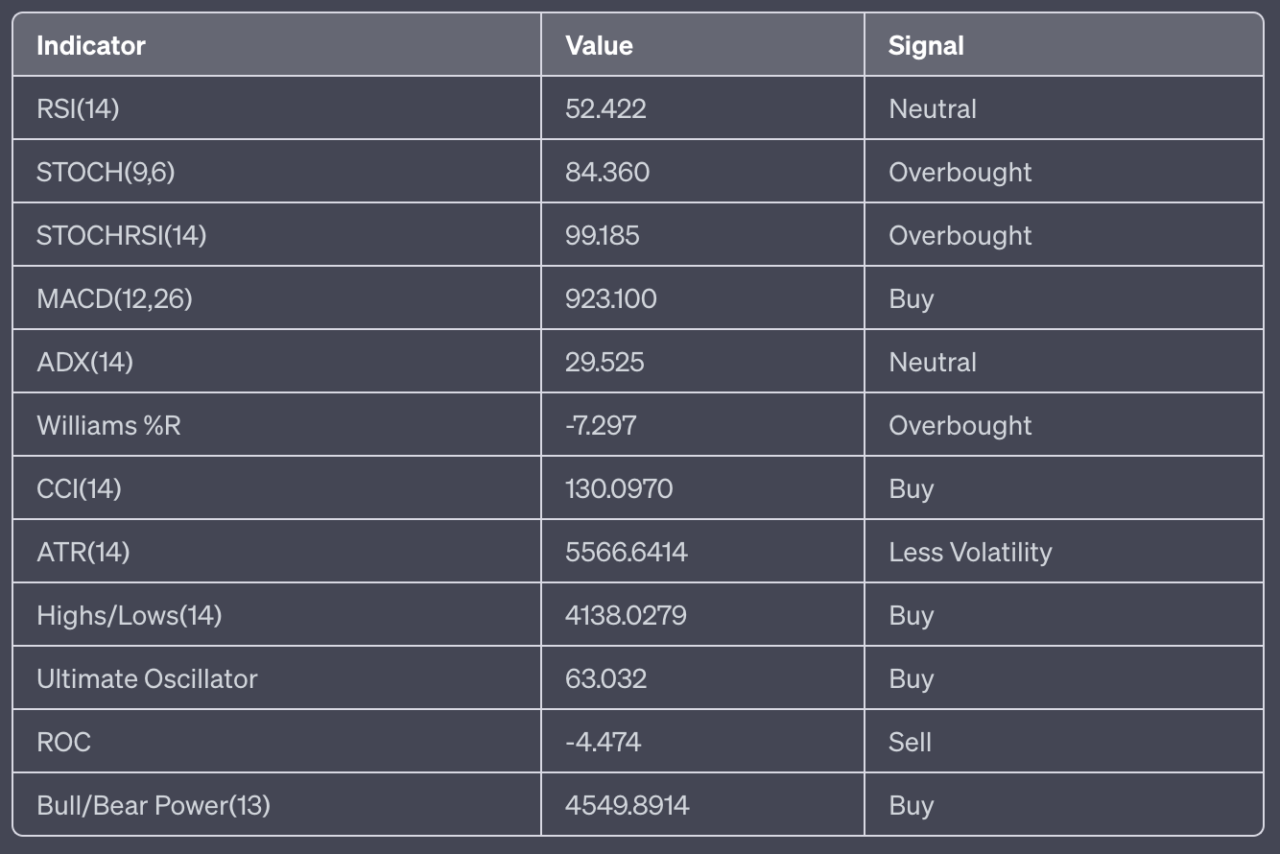
Here, the monthly technical indicators also suggest a “BUY” signal for Bitcoin:
- With five consecutively similar buy signals,
- One sell signal, and
- Two neutral signals.
The MACD, CCI, and Bull/Bear Power all incline towards a buy signal, pointing to bullish momentum. However, again like the daily and weekly indicators, the STOCH, STOCHRSI, and Williams %R show that Bitcoin is currently overbought, flagging a possible price correction within a short period.
Moving Averages
Besides the technical indicators, traders often rely on moving averages to smooth out price data. This way, they can better identify the trend direction for a particular cryptocurrency like Bitcoin. Let’s have a look at the moving averages for Bitcoin.
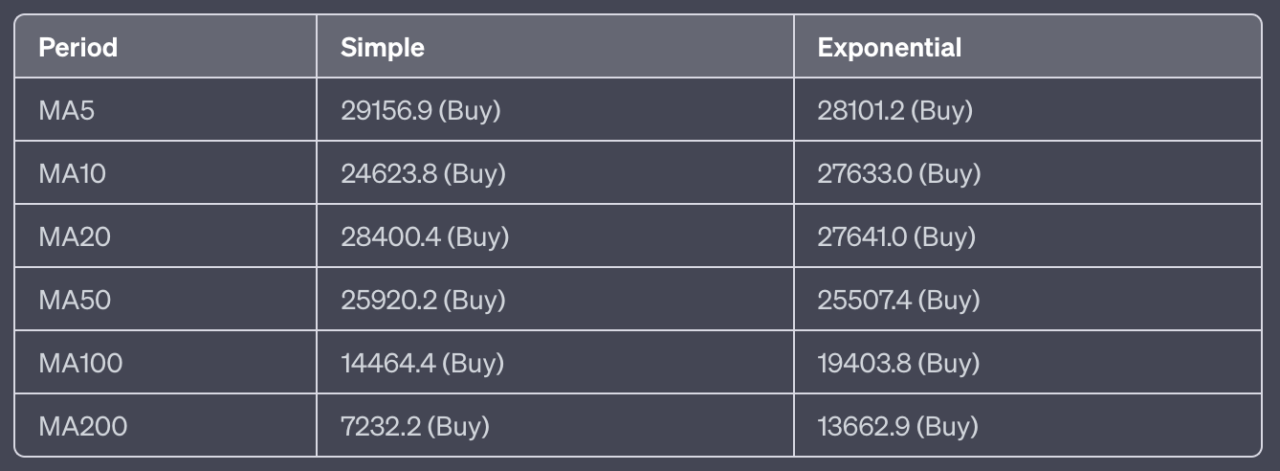
Summarily, the moving averages suggest a strong “BUY” signal for Bitcoin, with all twelve signals flagging a green light to buy. This indicates that the current price stays above the average price of the past 5, 10, 20, 50, 100, and 200 days. This is a common bullish signal among traders.
Conclusion
Given the technical indicators complemented by the moving averages, it’s clear that the sentiment for Bitcoin on 6th July 2023 leans bullish. Both the daily, weekly, and monthly technical indicators suggest a buy signal. It shows there’s bullish momentum despite signs of Bitcoin possibly being overbought, which could potentially trigger a price correction. Likewise, the moving averages present a strong buy signal for Bitcoin; the price moves above the average of the past several days.
However, the possibility of short-term price corrections due to overbought conditions shouldn’t be ignored. Thus, the overall trend for Bitcoin leans more bullish. Investors are urged to be aware of these mixed signals and to adequately align their investment strategies. Always remember that these insights are built upon current market conditions and historical data. But, it’s a known fact that market dynamics can change rapidly. Therefore, incorporating these insights alongside other market updates, your own research, and expert consultation is your best bet in making informed investment decisions.
Featured Image Credit: Photo / illustration by “Dylan Calluy” via Unsplash