Share:
Current Status of Fantom Price
- The Fantom price has been stagnating, unable to break past the significant hurdle of the 50-day EMA for nearly three months now.
- There has been an impressive growth of 97% in the network in just 30 days, owing to its rapid addition of new addresses.
- The increase in active addresses has the potential to elevate transaction numbers in the market, which in turn could boost the FTM price.
In the light of broader market cues, the Fantom price is poised for a possible recovery. However, the delay is causing tension among FTM holders. As a response, investors are adjusting their tactics from merely following the market to possibly influencing the price action through their actions.
The Need for a Bullish Trigger for Fantom Price
At the time of writing, the Fantom price, sitting at $0.2720, has been mainly flat for most of the past week. This comes after a failed attempt to pass the 50-day Exponential Moving Average (EMA), which was at $0.3060 at the start of the month. While the price action chose to pause, investors didn’t, and this is evident in their on-chain behavior.
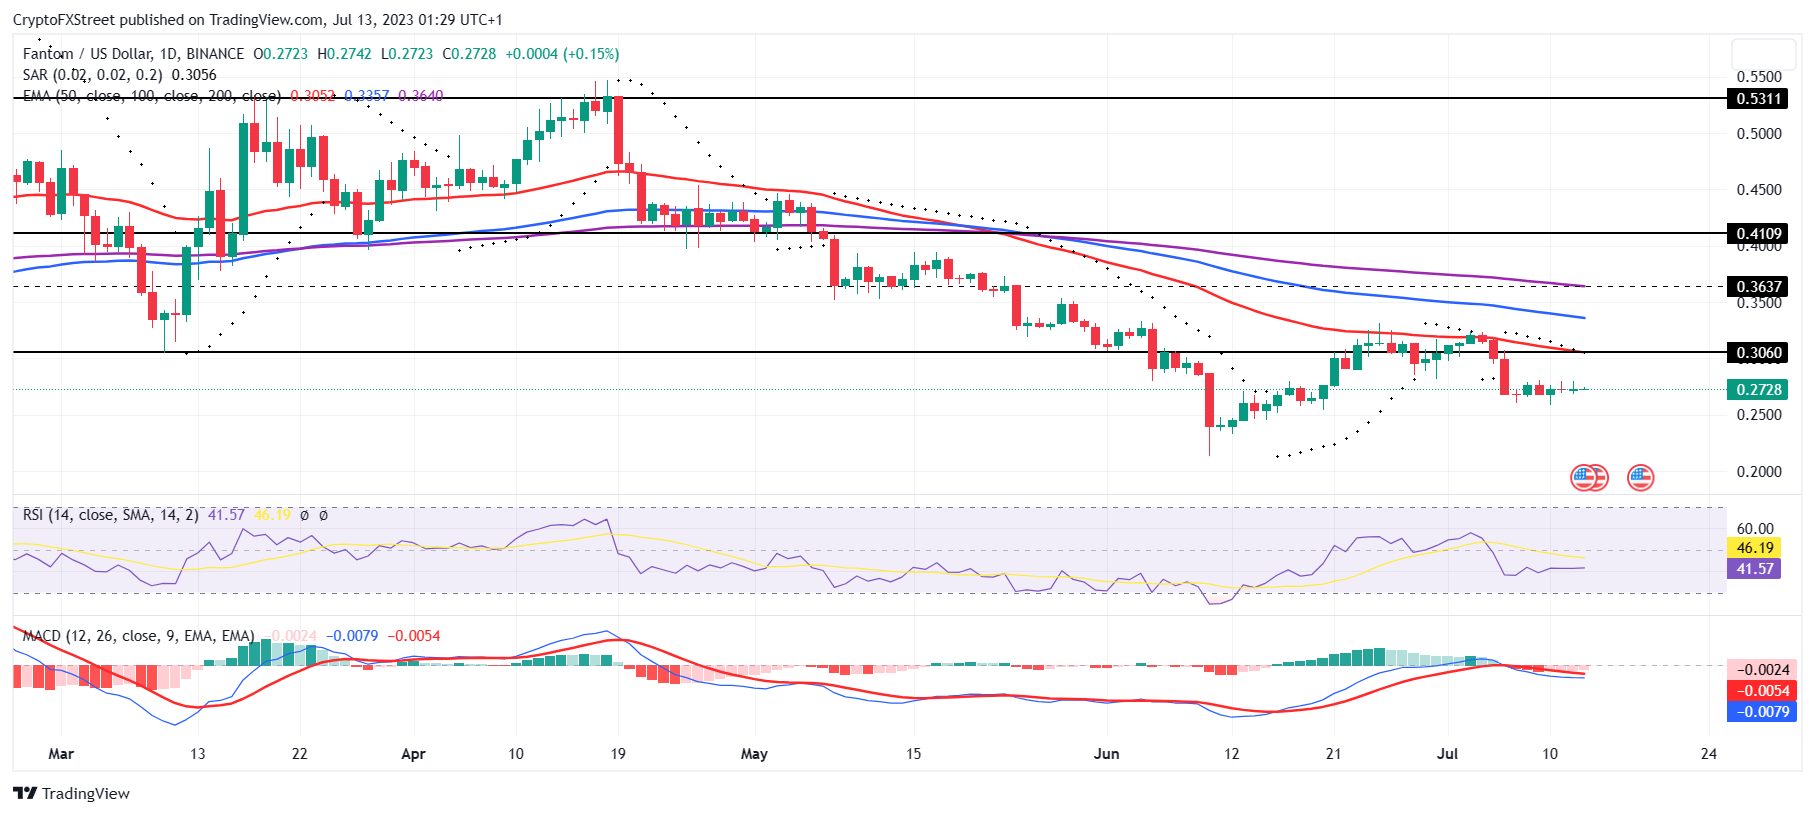
FTM/USD 1-day chart
Over each day, the presence of FTM holders keeps increasing. In the past month, their activity has surged by 97%. The active addresses, which were down to an average of 164 in June, now stand at 264. Despite the market’s current condition, this growth is seen as positive.
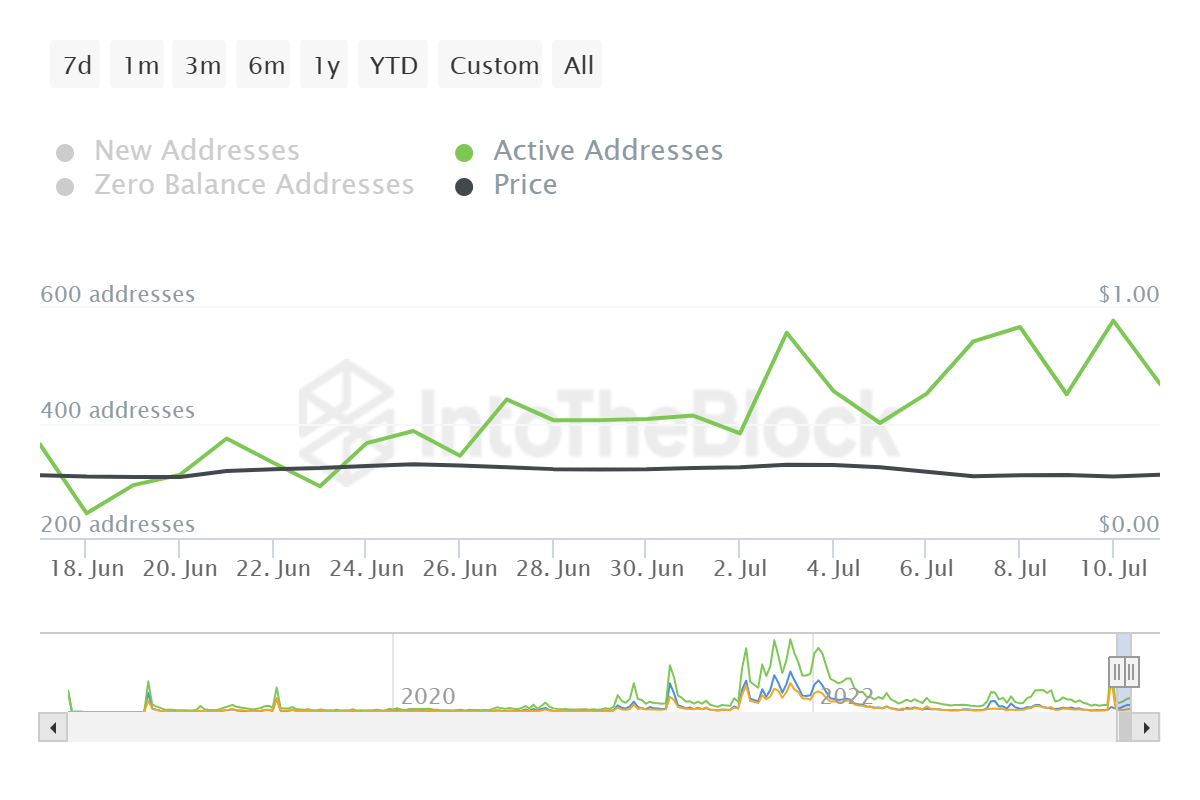
Fantom active addresses
Transaction Volumes and Network Growth
This increased activity isn’t confined just to presence. The network has seen a significant rise in on-chain transaction volumes. This time last month, the Fantom network was logging transactions worth $2.87 million. Currently, the value has skyrocketed to $8.72 million.
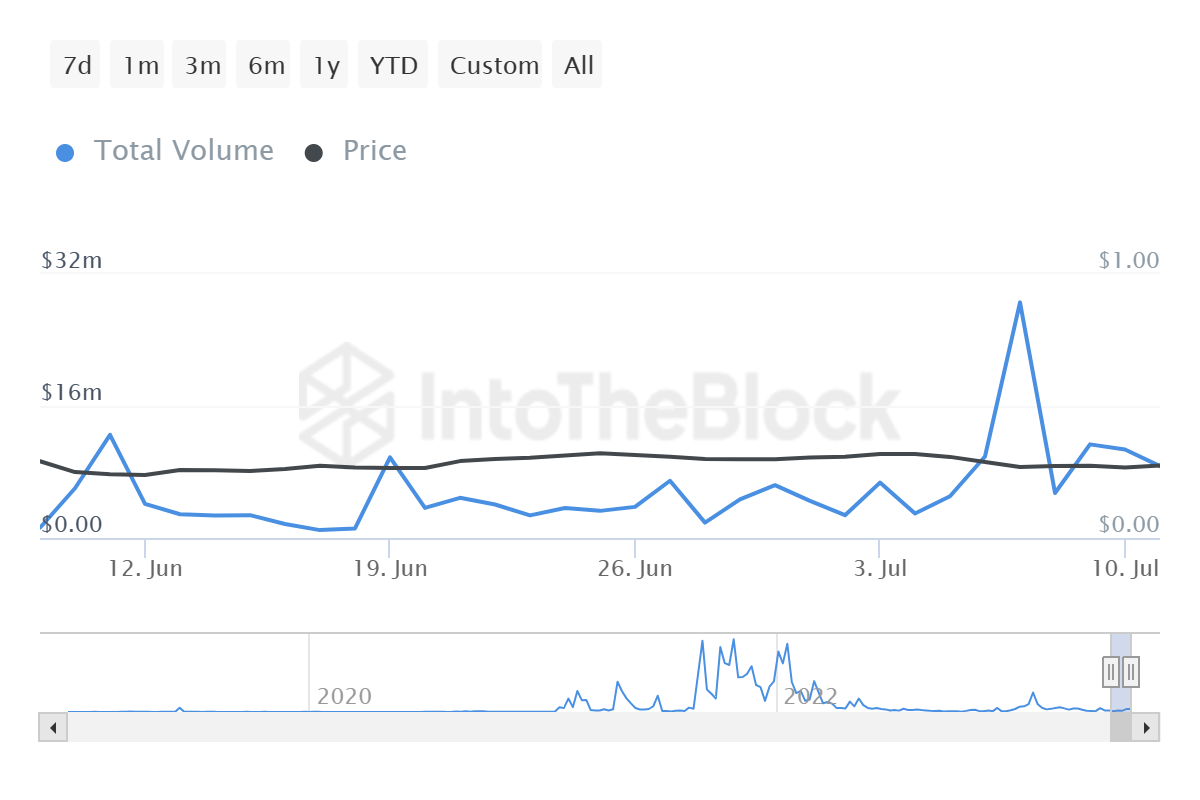
Fantom transaction volumes
Notably, this bullish trend also extends to the newer addresses entering the network. The network growth indicator, which measures the rate at which new addresses are created, shows this.
From mid-June until now, this rate of new address creation has surged by 45% and continues to rise. Increasing network growth is usually seen as a bullish signal, indicating a potential price rise over time.
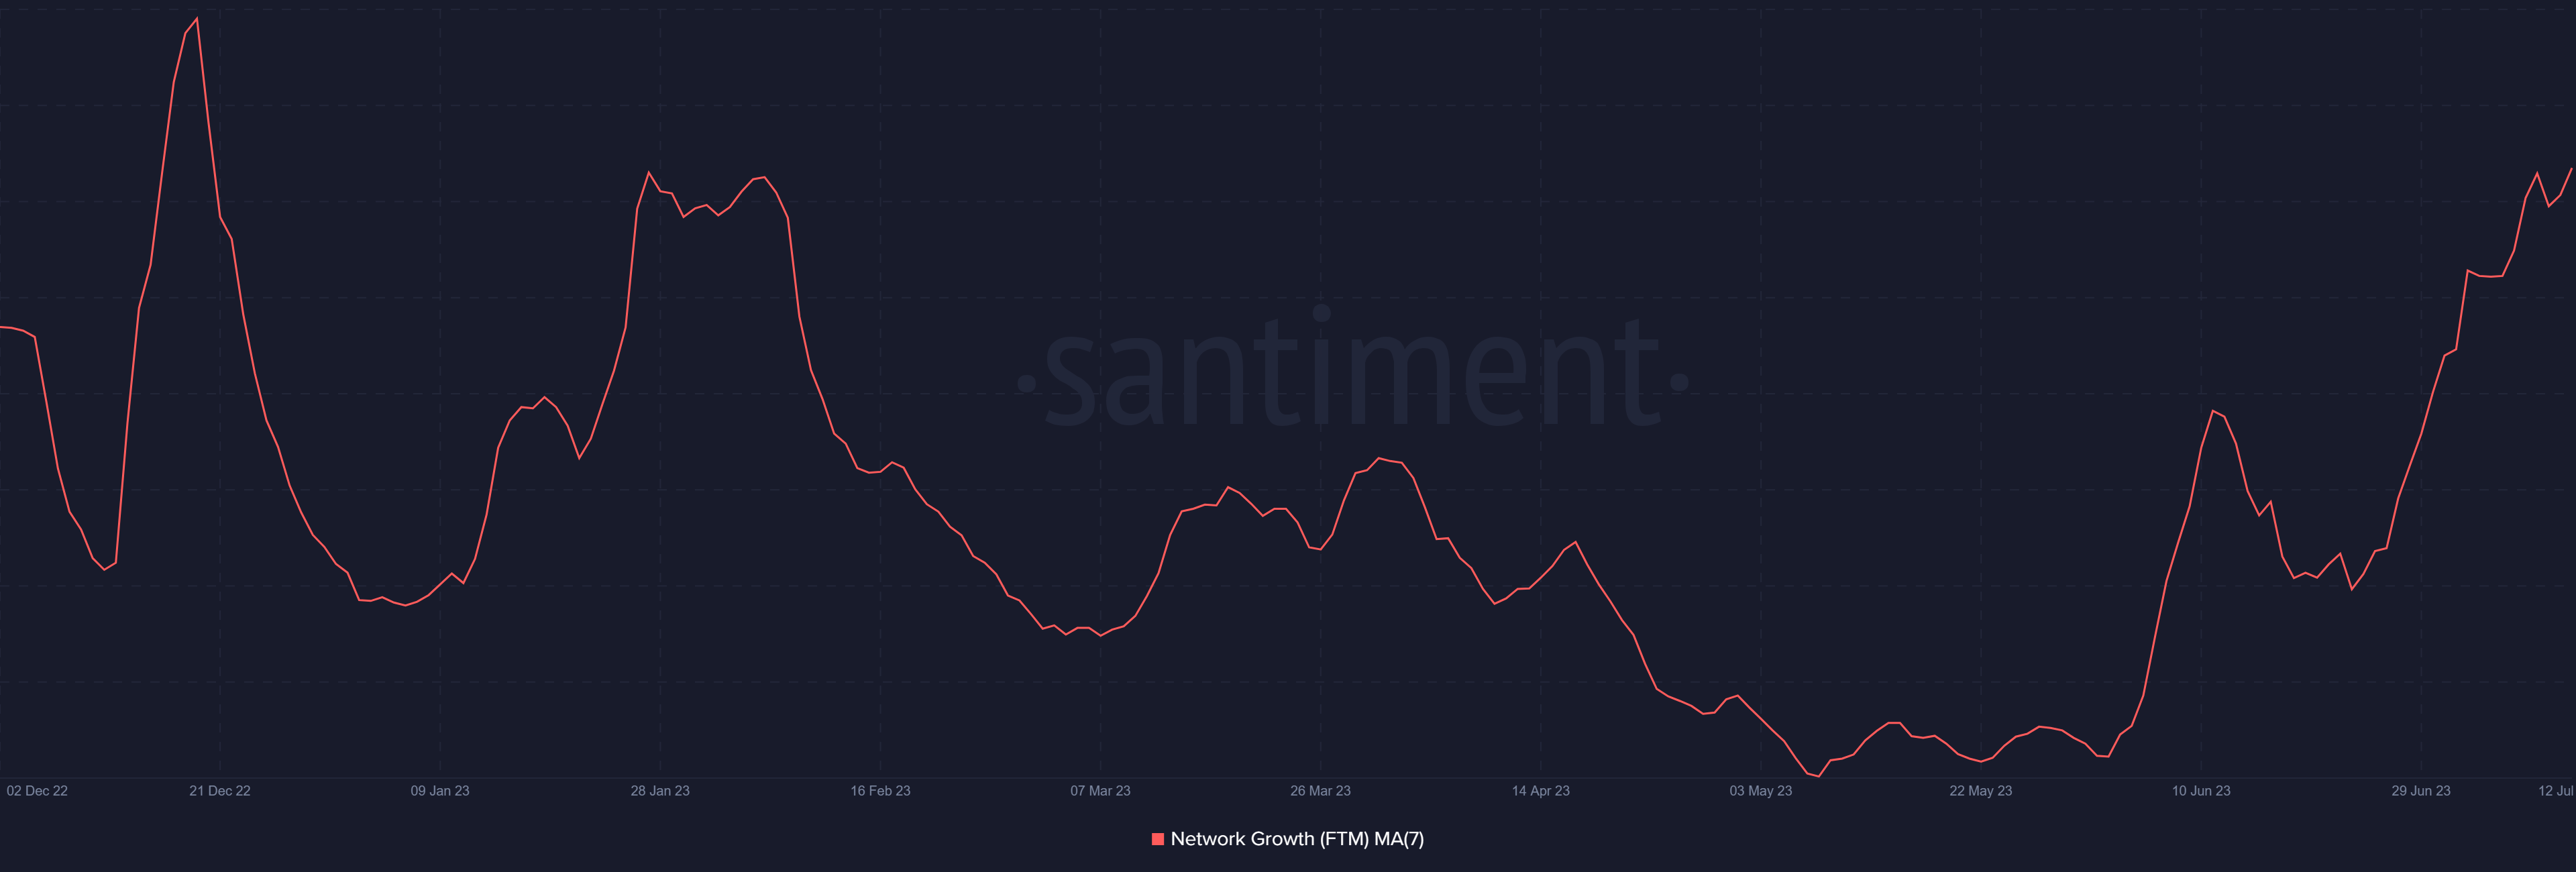
Fantom network growth
Price Indicators and Predictions
If this holds true for the Fantom price as well, the essential barrier would be the 50-day EMA. This could only be crossed once sufficient bullish momentum is created.
Currently, the price indicators, Relative Strength Index (RSI), and Moving Average Convergence Divergence (MACD), both show bearish signals. As these signs turn bullish, FTM holders can anticipate a corresponding rise in the Fantom price.