The recent drop in Bitcoin’s price suggests a meager intention towards recovery, casting a negative outlook in the short term. Bitcoin’s market dynamics have offered minimal indications of a price recovery after last week’s plunge.
Today, we take you through a comprehensive technical and on-chain analysis of bitcoin’s performance. Both analyses aim to give potential investors a clearer understanding of market trends, key resistance zones and areas of support to look out for in the ensuing weeks.
1. Technical Analysis
By Analyst: Edris
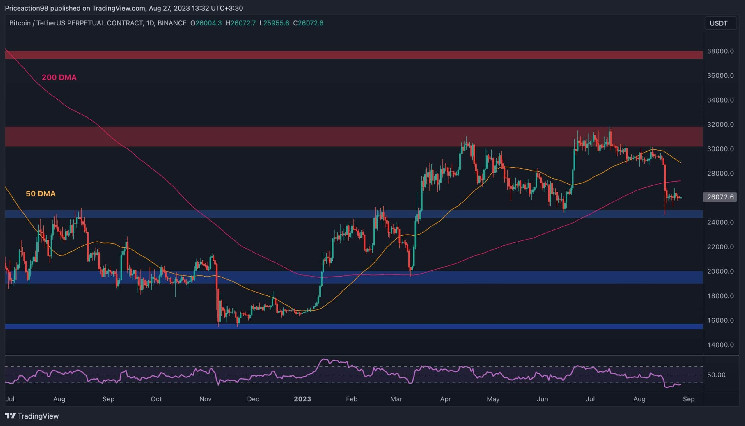
1.1 The Daily Chart
Upon examining the daily chart, one can identify a well-defined tight range in which the price has consolidated over the recent days. This follows a notable drop from the $30K region, a critical resistance zone.
Key Observations:
- The 200-day moving average line has been breached to the downside, offering a clear signal of a bearish trend.
- However, the RSI (Relative Strength Index), indicating an oversold signal, suggests that the price may retract higher in the short run.
- A subsequent retest of the 200-day moving average is anticipated. A failure to climb above this average could trigger a deeper decline over the ensuing weeks.
- The key $20K level could potentially be tested again should a substantial drop ensue.
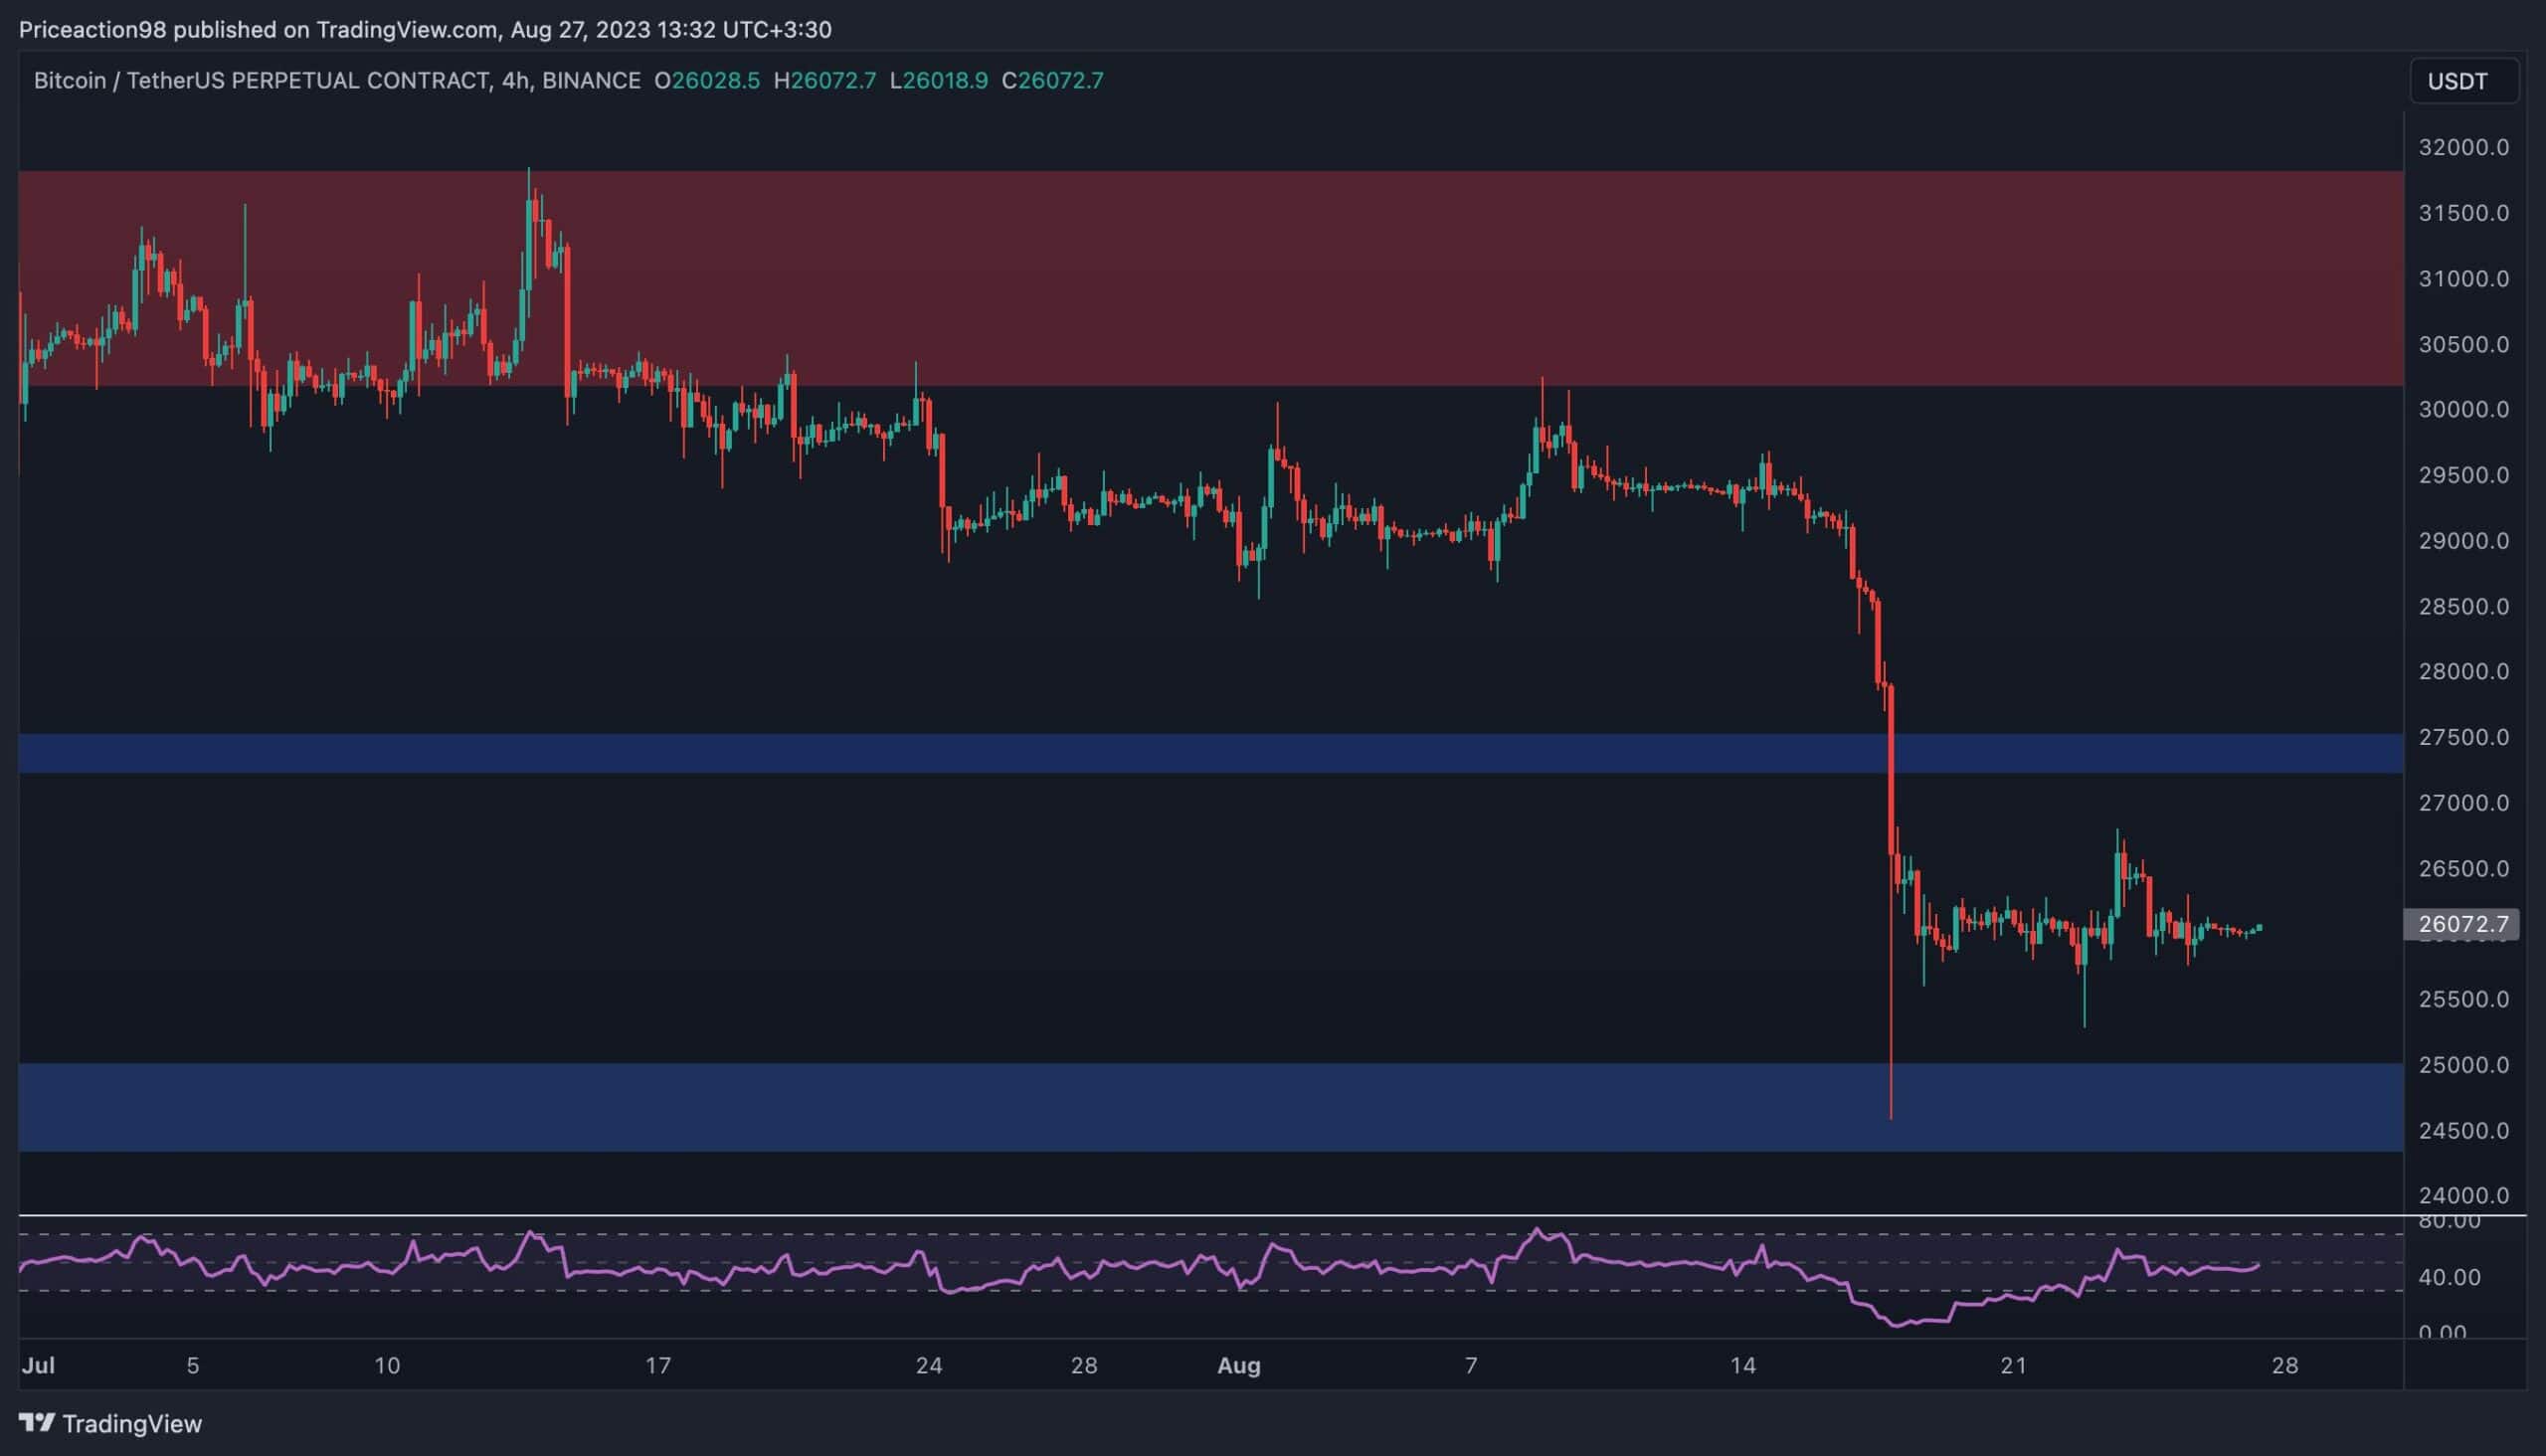
1.2 The 4-Hour Chart
Upon examination of the 4-hour timeframe chart, the price appears to be fluctuating between the $27,500 and $25,000 levels.
Key Observations:
- If market trends result in a climb above the $27,500 resistance level in the coming weeks, the significant $30K zone could potentially be tested again.
- However, the overall market structure suggests that if the $25K support level fails to hold, a further bearish continuation is highly probable.
2. On-Chain Analysis
By: Edris
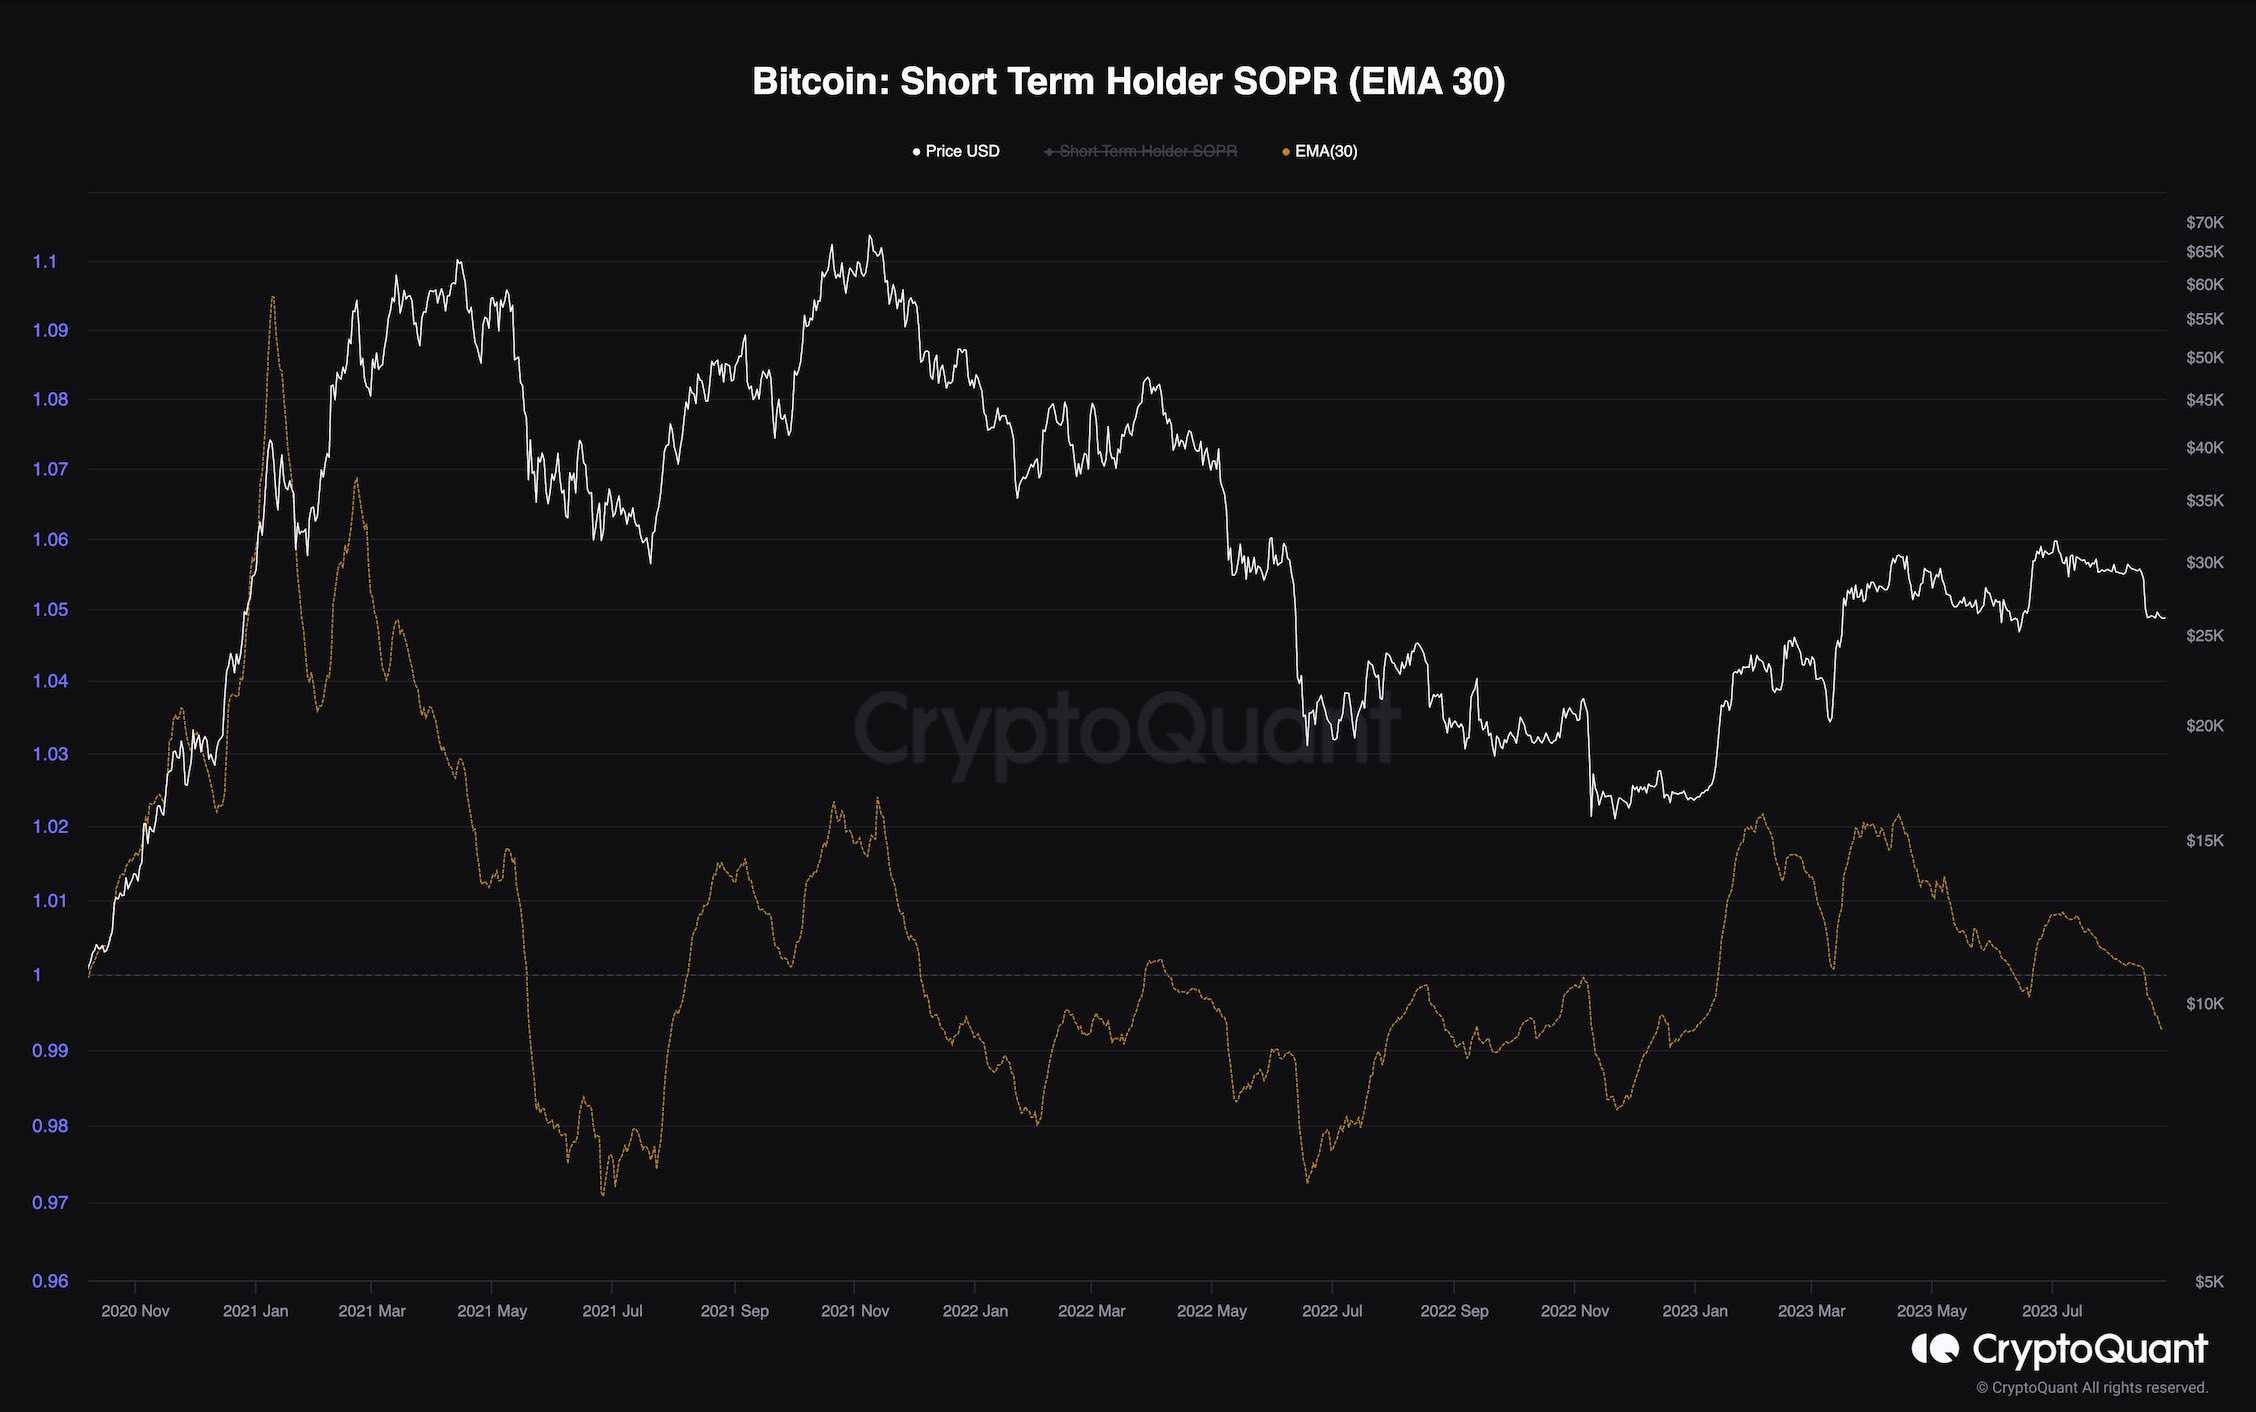
2.1 Bitcoin Short-Term Holder SOPR (Spent Output Profit Ratio)
Bitcoin has recently faced a crash after failing to break above the crucial $30k mark. This failure has stoked fears that the bear market hasn’t reached its nadir.
Below, we present a chart indicating the Bitcoin Short-Term Holder SOPR with an applied 40-day exponential moving average. The SOPR represents the profitability ratio of spent outputs (coins that lived less than 155 days) for digital currency holders.
Key Observations:
- Values above 1 indicate that short-term investors are offloading their holdings for profit, while values below 1 suggest losses are being incurred by them.
- The chart shows that after more than six months, this metric has dropped back below 1.
- This signal implies that short-term holders are selling their coins at a loss, a behavior typically seen during bear markets.
- However, a swift recovery of the metric back above one could potentially render the recent drop as a bear trap, bringing about a shift in market dynamics.