Analysis of FLOW’s Price Fall
FLOW’s value has seen an extended phase of decrease. Its levels have been dropping low from its peak and forming patterns of lower lows. FLOW’s prices have dropped down by about 1.90% alone in the last 24 hours. This marks yet another undulating move in the crypto market’s price action.
The Perception about FLOW
The price data obtained for FLOW presents a grim picture. The market sentiments about this cryptocurrency seem to be largely negative. The highlights of these figures are:
- Despite this, FLOW’s value witnessed a rise of 1.84% in the past week.
- FLOW recorded a high price of $42.40 from which it suffered a heavy drop, plummeting by -98.58% over the course of 2 years.
- This significant fall has caused significant reductions in investors’ wealth levels.
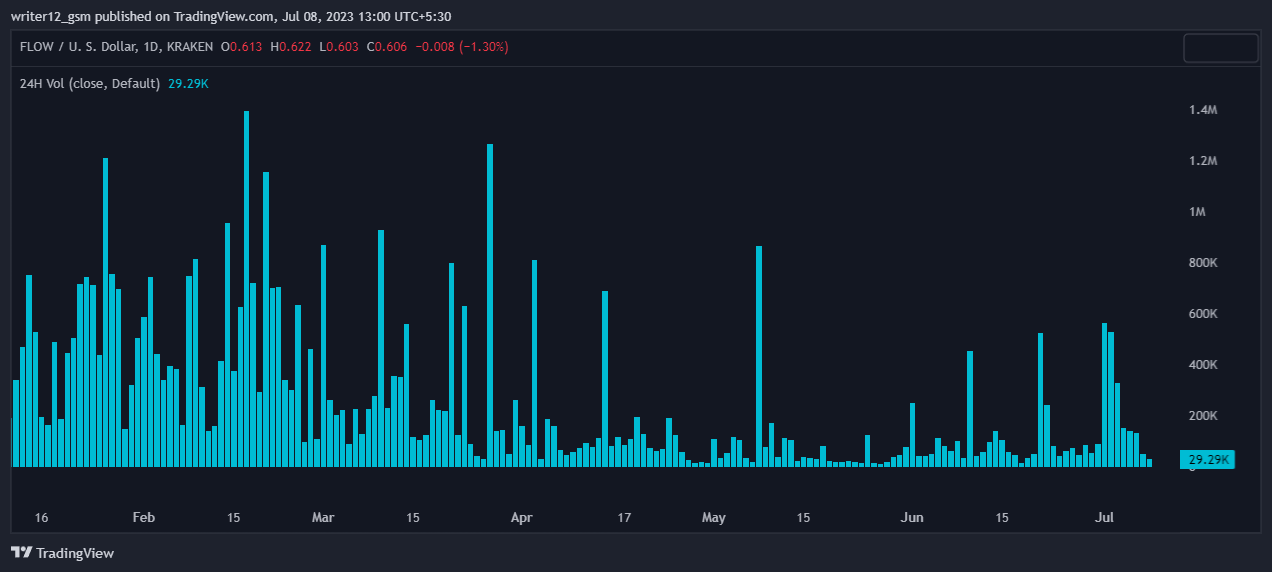
- The volume chart for FLOW coin is also showing discouraging results, depicting an absence of buyers.
Technical Analysis for FLOW Coin
The technical analysis for FLOW presents a worrisome picture for investors. Here are the specifics:
- The FLOW coin price has fallen below the line for both 50 and 200 MAs (Moving Averages). This drop has occurred with a bearish crossover which signifies the powerful influence of sellers in the market.
- If sellers continue to drive the market lower, it is likely that FLOW might undergo further declines and slip into a steep downtrend.
- The charts also depicted a bearish cross recently, this also serves as a negative indicator for the coin.

Source: Flow/US DOLLAR by TradingView
RSI Line Observation
The RSI line (Relative Strength Index) for FLOW has been trading near the oversold zone with an RSI of around 51.25. The 14 SMA (Simple Moving Average) has a value of 52.14 points revealing that the market for FLOW Coin seems to be oversold. Despite this, the possibility of a considerable fall in Flow’s prices still remains.
MACD Signals
As of now, the MACD (Moving Average Convergence Divergence) is giving bearish signals. The MACD line marked at 0.012 and the signal line at 0.02 rise above the zero line, suggesting that the MACD is in positive territory. It is providing neutral signs as of the moment.

Source: Flow/US DOLLAR by TradingView
Volume Analysis for FLOW
The FLOW trading volume of 24 hours stands at $12,696,516 with a drop in volume of -55.00% in the past 24 hours. The coin has not shown any significant increase in its volume.
Technical Levels
The coin has a few key support and resistance levels which are as follows:
- Support – The prevailing level of support for FLOW stands at $0.418.
- Resistance – Currently, FLOW’s resistance level is located at $0.777.
Wrapping-Up
FLOW seems to be encountering tough times in the market. As per the updated data and comprehensive analysis, it can be concluded that FLOW suffers under the dominance of the bear. The current performance of the price signifies a probable further fall in the following days since the price has breached its key trendline support level.
At present, FLOW’s price paints a grim picture. Key reliable indicators such as EMA (Exponential Moving Average), RSI, and MACD are all producing bearish warnings about the FLOW coin. The fear among investors is escalating because of the disappointing performance of the coin. No signs of recovery are evident in the coin at the moment.
Risk Disclaimer
The details and analysis provided in this article should serve for informative and educational purposes only. It should not be employed as financial, investment, or trading advice. Involve yourself in cryptocurrency investing and trading at your discretion as it presents a risky endeavor. Always consider your personal circumstances and your risk profile before making any significant investment decisions.