Bitcoin Price Stability: Observing Key Support Zones
Bitcoin’s price has been consolidated above a significant support zone of $30,000. This level is critical in maintaining the digital currency’s positive trajectory. For Bitcoin to maintain an upward momentum, it needs to secure a steady position above the $31,000 and the $31,400 levels.
Recent Bitcoin Performance: Positivity and Resistance
- In the context of recent market movements, the Bitcoin price has shown some positive indicators associated with the $30,000 support zone.
- As proof of this stability, the current trading price is above $30,200 and maintains above the 100 hourly Simple Moving Average (SMA), an indicator used by traders to analyze price trends.
- Further supporting the bullish outlook, a short-term upward trend line is forming, taking into account the support, standing around $30,400 on the hourly chart of the BTC/USD pair, basis the data sourced from Kraken.
- If the price continues to hold above these levels, closing above the $31,200 mark could usher in a wave of bullish momentum.
Bitcoin Price Stability Over $30,000
Despite a slight decline seen in the Bitcoin price below the $30,500 support zone recently, there’s been consistent activity from the bulls that did not allow the prices to slip further below the $30,000 mark. BTC ranged at this level, and although it tried to break the $31,000 mark, it was unsuccessful.
An interesting development is the recent low that was formed around $30,214. It’s seen that the price has since been trending higher, crossing above the 23.6% Fibonacci retracement level. This instance is calculated considering the decline from the recent high of $31,020 to the $30,214 low. Presently, a short-term bull trend line with support around $30,400 appears to be forming based on the hourly chart of the BTC/USD pair.
In its current state, Bitcoin’s price is hovering above the $30,200 mark and the 100 hourly SMA, indicating a positive outlook. However, it is encountering resistance near the $30,600 level. If it manages to break this resistance, it might head towards the next resistance level located at $30,700.
When we consider the 61.8% Fibonacci retracement of the reduction from the recent peak ($31,020) to the recent low ($30,214), it’s positioned near this next resistance level. For the price to start a stable ascend, it needs to settle above the $31,000 mark. If it manages this, then the next major hurdle to surpass would be the $31,400 level. Crossing this might pave the way towards the $32,000 resistance zone.
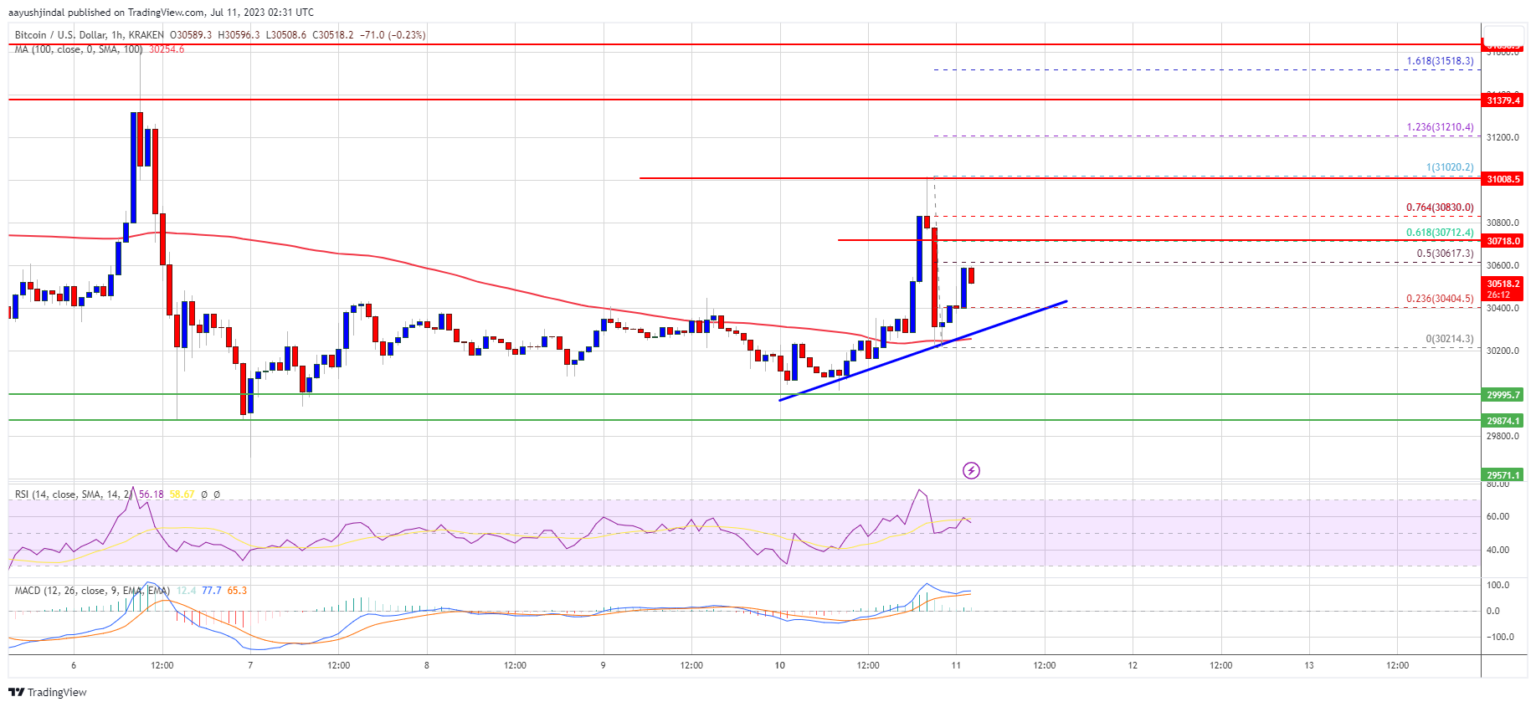
Source: BTCUSD on TradingView.com
Are More BTC Losses On the Way?
If Bitcoin fails to surpass the $30,700 resistance level, there may be another decline looming. The immediate downside support is at the $30,200 mark and the trend line. Following this, Bitcoin could potentially drop to the next major support which is at the $30,000 level. If the price dips below this level, it could potentially fall further to the $29,850 mark. Any further price drops might see Bitcoin falling towards the $29,400 level.
Significant Bitcoin Technical Indicators:
- Hourly MACD – The Moving Average Convergence Divergence indicator is gaining pace in the bullish zone, indicating a positive trend.
- Hourly RSI (Relative Strength Index) – Bitcoin’s RSI, currently above the 50 level, signifies that it’s withstanding selling pressure well.
- Major Support Levels – $30,200 is the first notable support level, followed by a significant level at $30,000.
- Major Resistance Levels – Bitcoin will face its first major resistance at the $30,700 level, followed by $31,000, and then the $31,400 level.