Deep Dive into Bitcoin’s Recent Price Crash
Bitcoin, the world’s most popular cryptocurrency, experienced a significant price crash recently, with a downfall of nearly $5,000 in a span of one day. This considerable drop in the price of Bitcoin has had significant implications, not just for Bitcoin investors but for the overall market trend as well. In this in-depth analysis, we take a closer look behind the scenes of this catastrophic event and unfold its possible repercussions.
Understanding Bitcoin’s Price Fluctuations
1. The Technical Analysis
Analyst: Edris
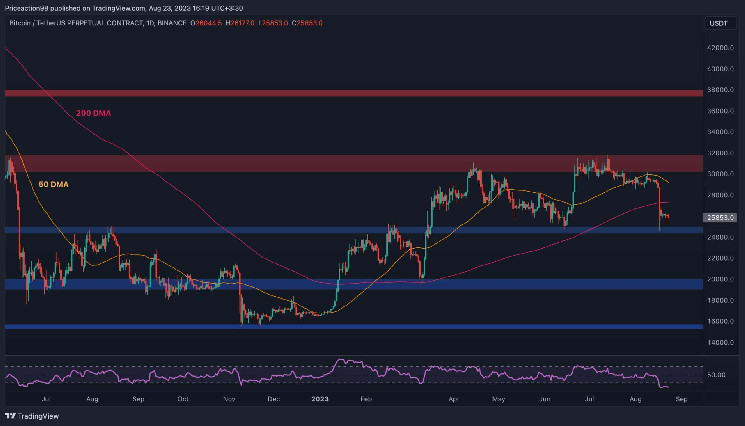
1.1 The Daily Chart
On a day-by-day basis, the Bitcoin price has hit a brick wall at the $30K resistance level numerous times in the last few months. The most recent rejection from this level, combined with the 50-day moving average being at almost the same price level, has triggered a considerable fall.
Moreover, Bitcoin value broke past the pivotal 200-day moving average around the $28K level. As this is a significant trend indicator, a drop below it could be indicative of a probable shift towards a bearish trend.
Nevertheless, the $25K support is holding off the price for now, effectively stopping it from taking a nosedive. But, with the pervasive market structure turning bearish, the odds for a pullback to the 200-day moving average and an eventual even lower value in the forthcoming weeks seem fairly substantial.
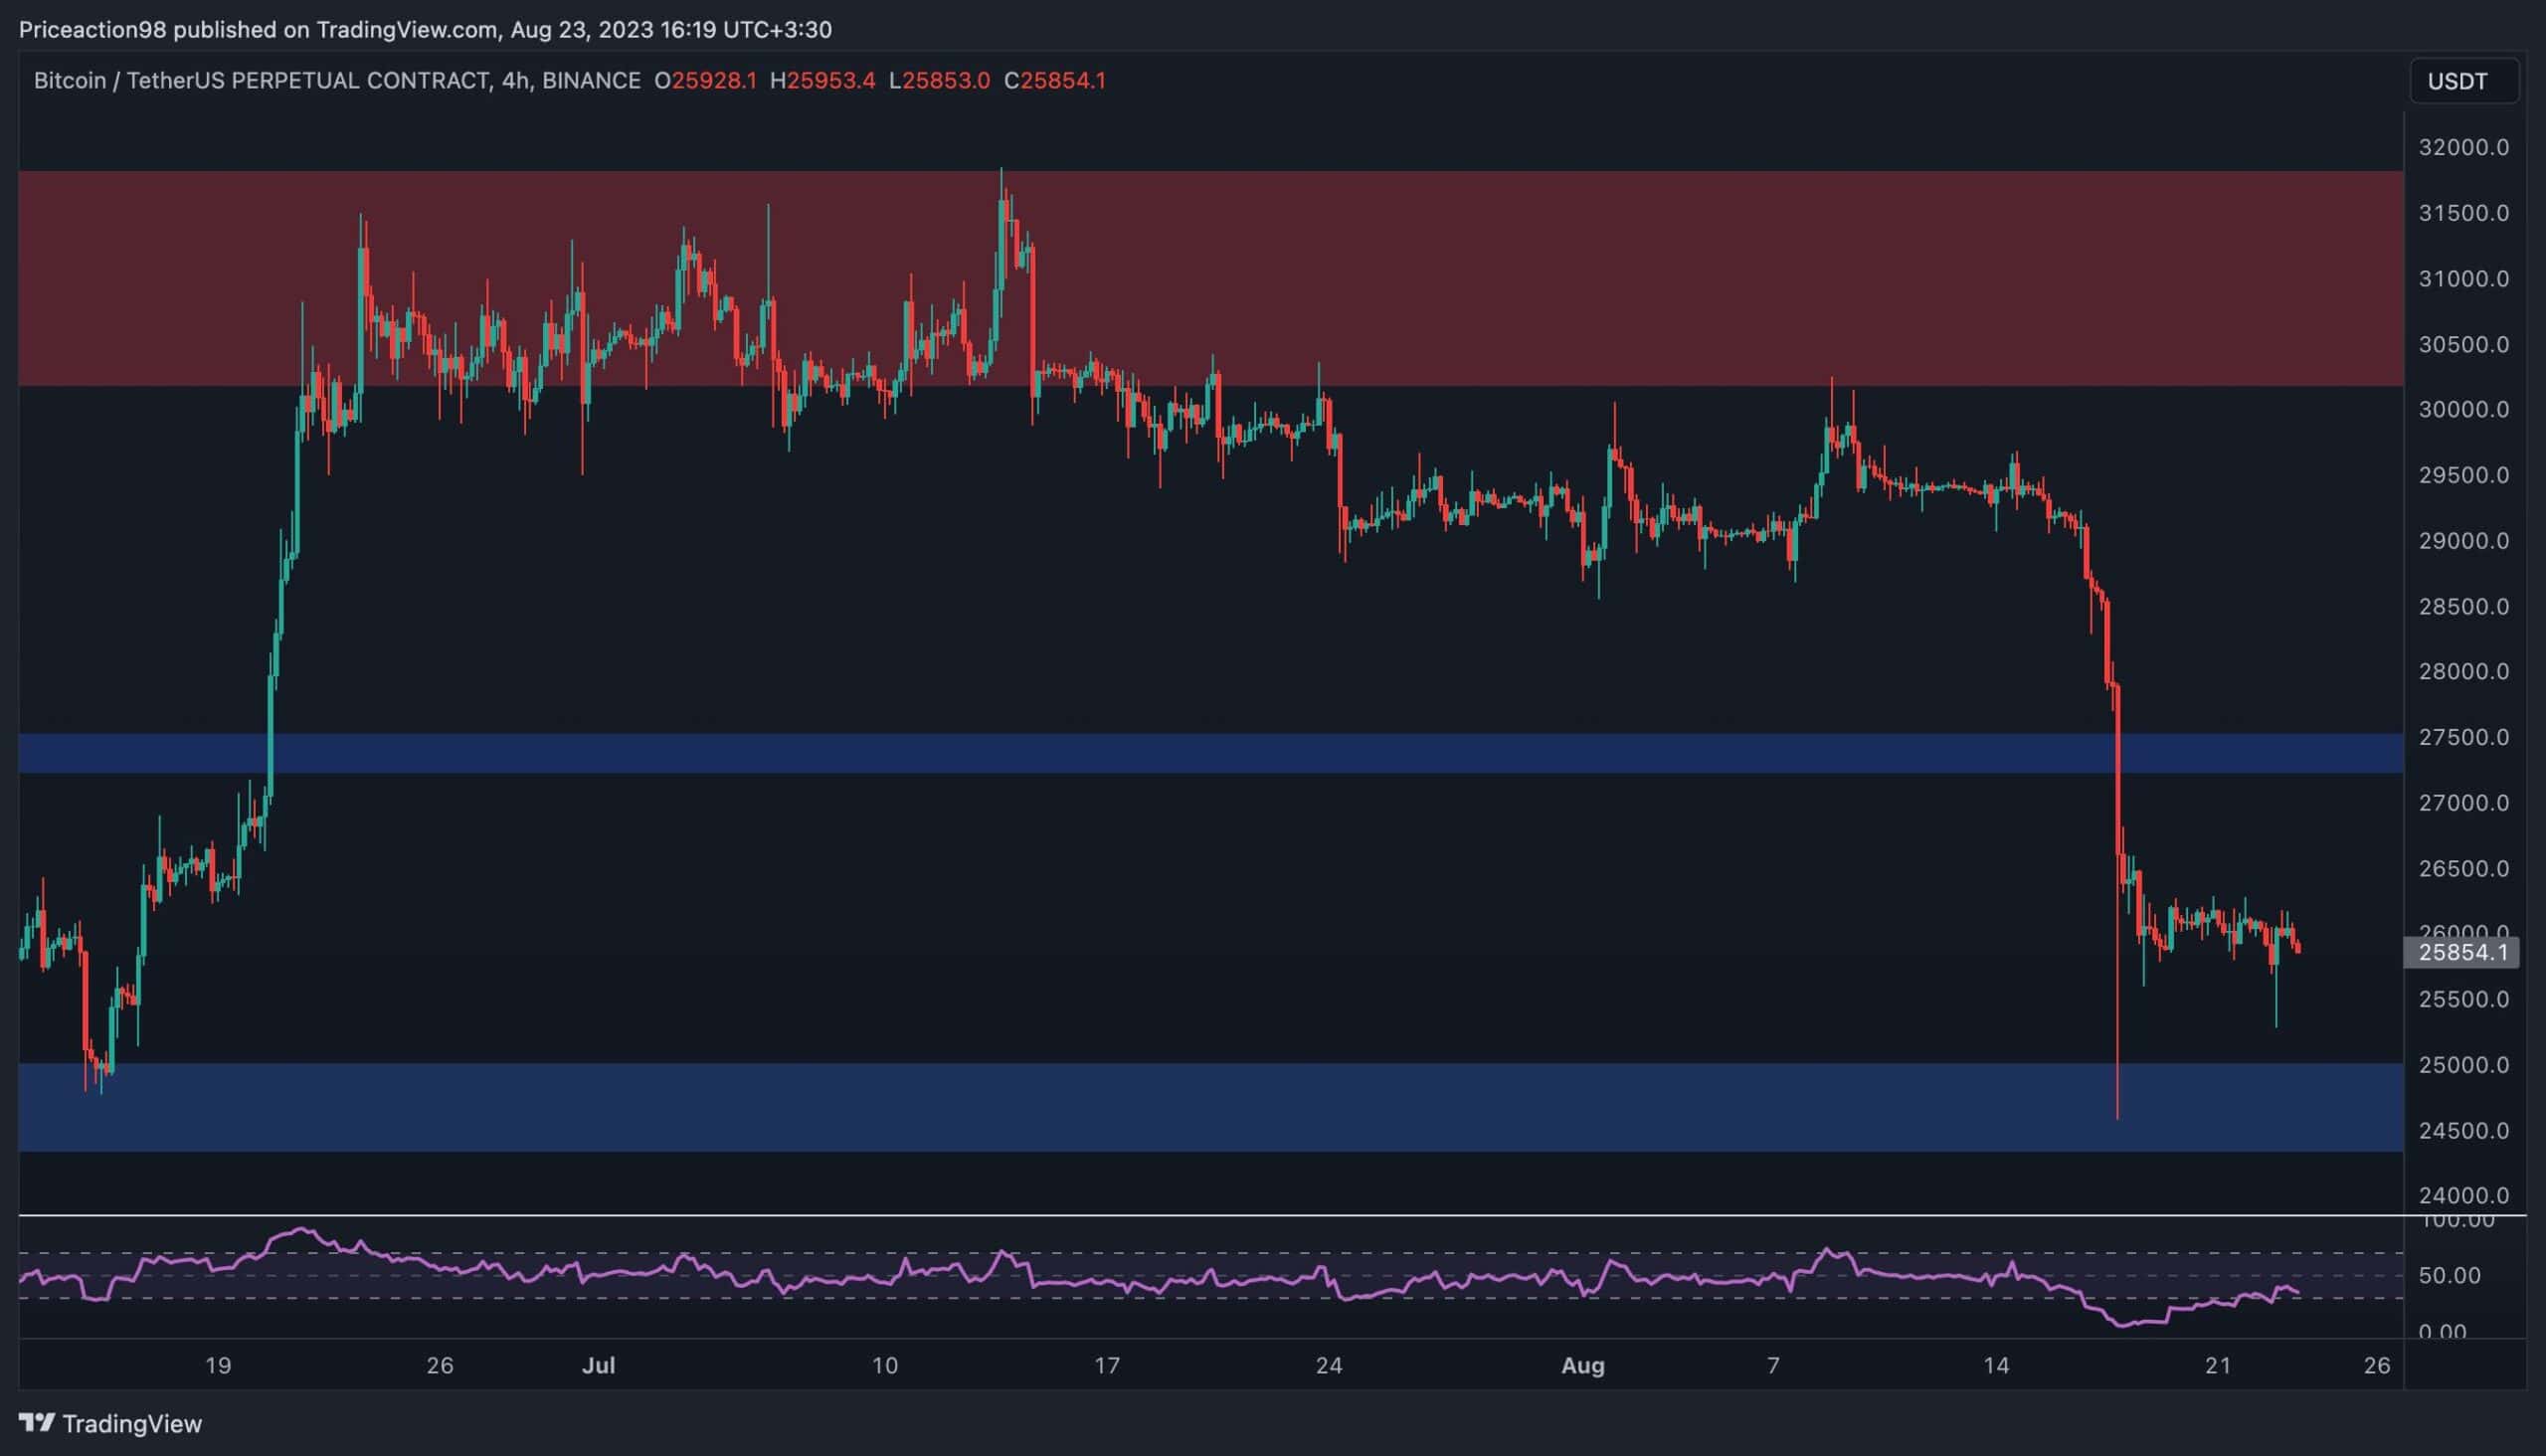
1.2 The 4-Hour Chart
From a four-hour chart perspective, the recent decline appears much more sudden and intense.
The $27,500 initial support level and the $25K subsequent level were effortlessly broken, even though the price momentarily dropped above the latter. However, the tides seemed to turn as the market entered a consolidation phase on this timeframe, with the $25k line acting as a formidable barrier preventing further drop.
Meanwhile, the Relative Strength Index (RSI) indicator, which was previously oversold, has somewhat recovered, still resting below the 50% mark. This indicates that while the price may currently be hovering, the momentum remains overall bearish, suggesting another possible price attack on the $25K zone in the short term.
2. The Sentiment Analysis
Analyst: Edris
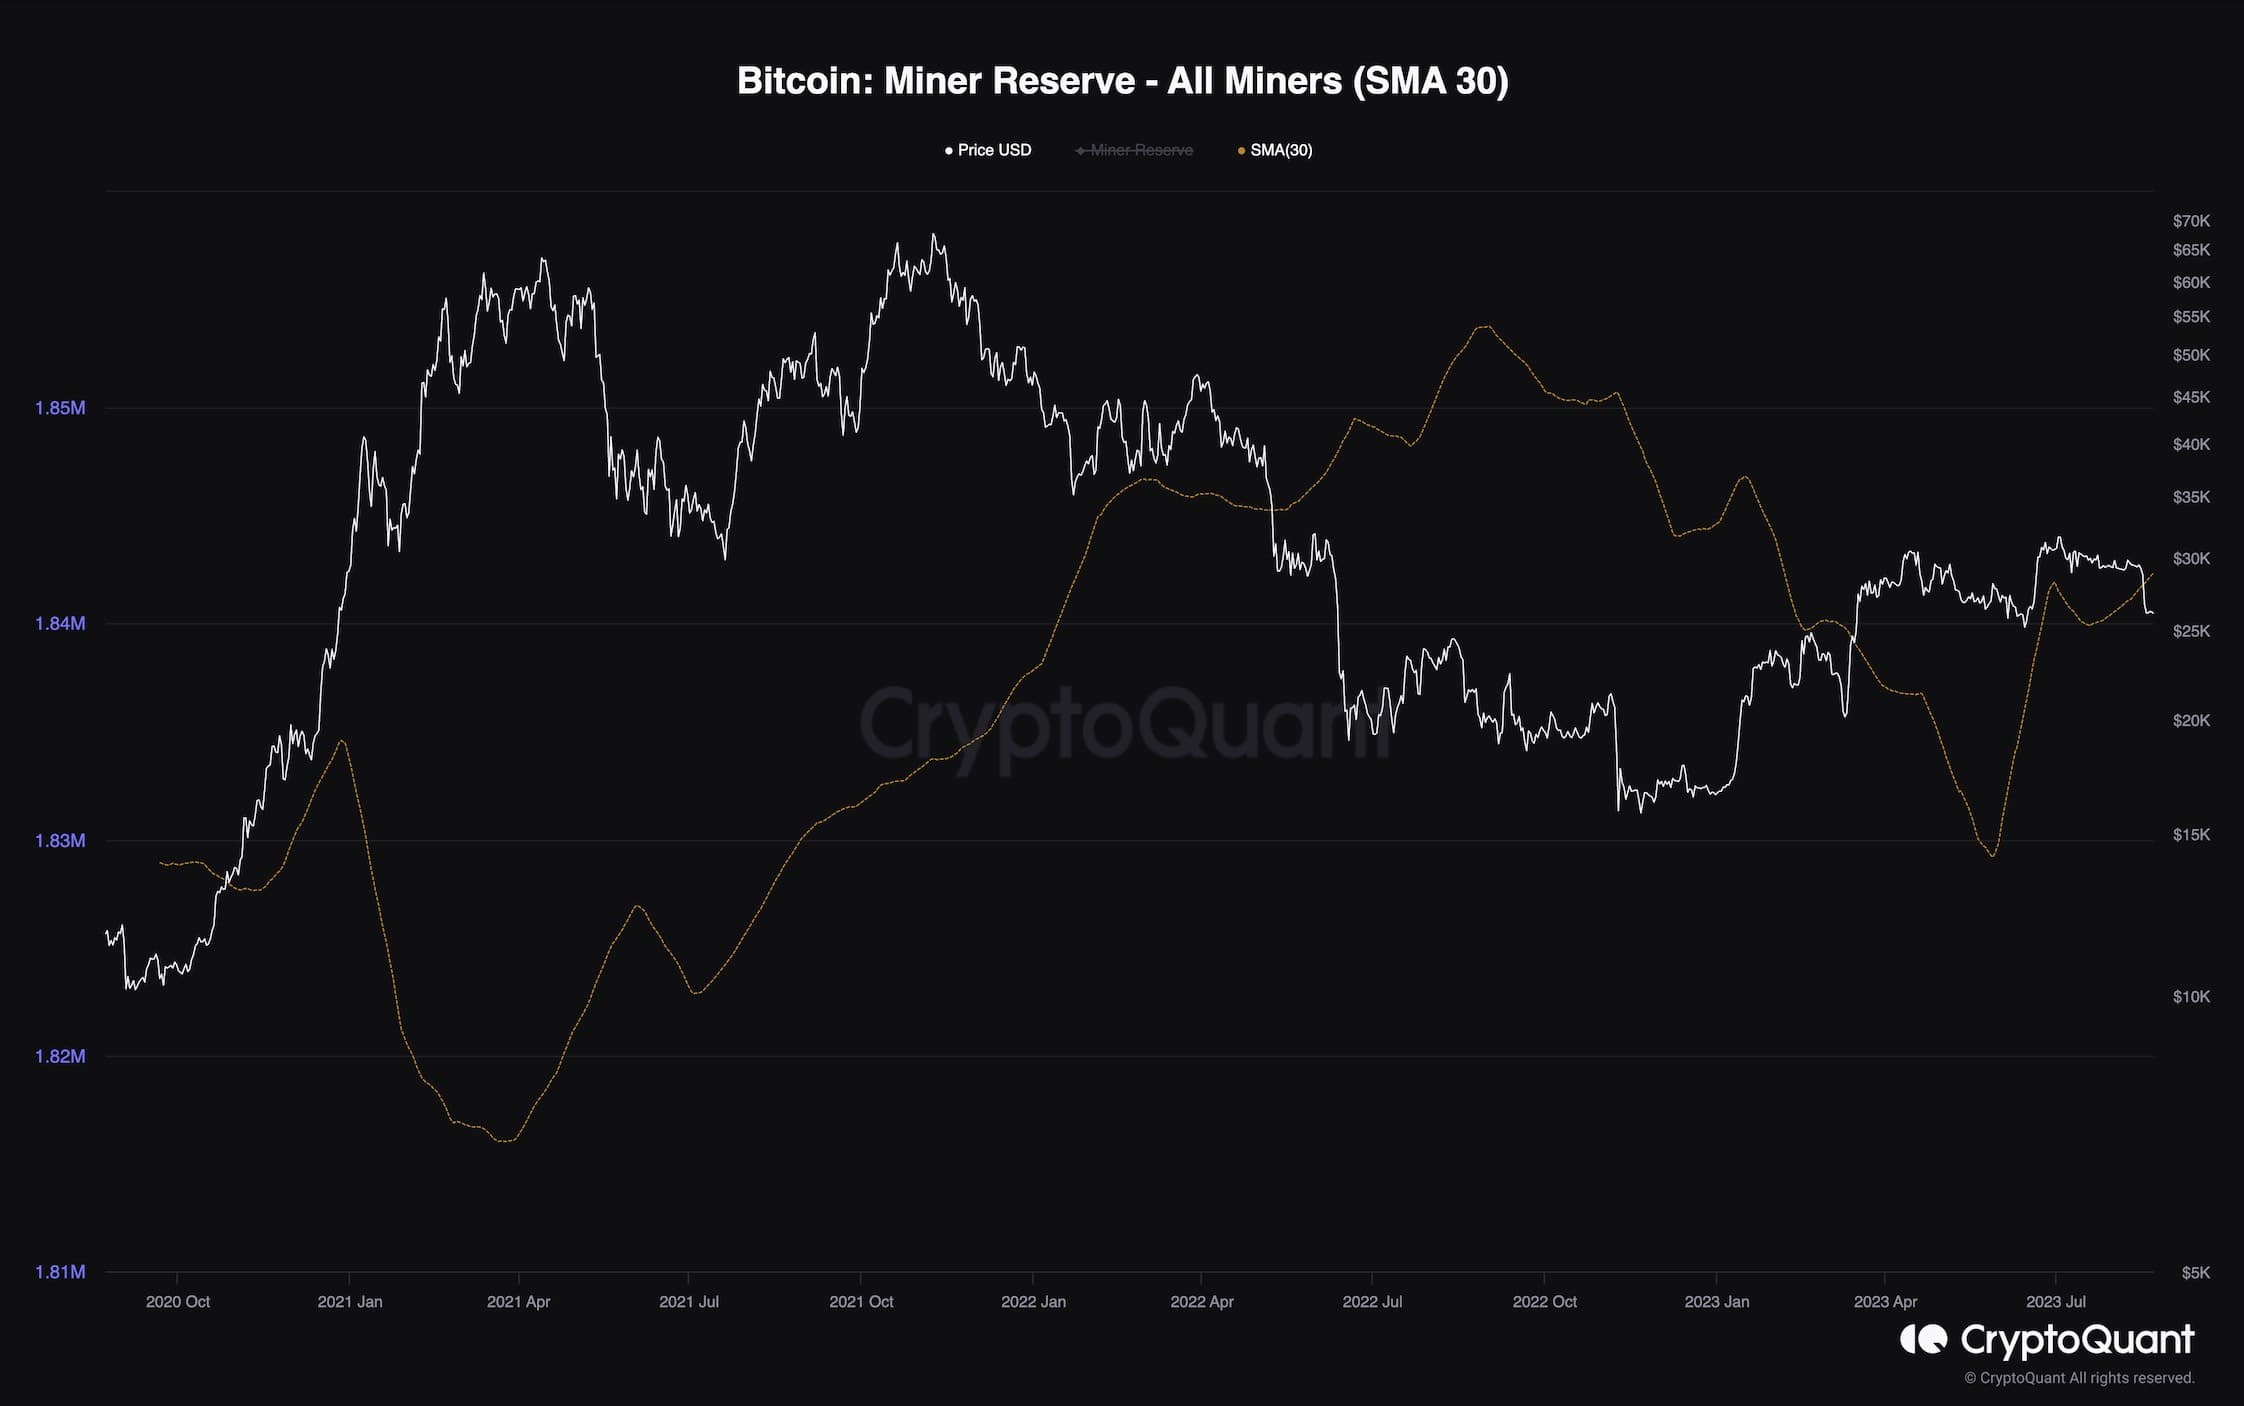
2.1 Bitcoin Miner Reserve
Anticipation for Bitcoin’s price to surge seems to have waned over the last few months, as it continues to consolidate below the $30K line. In this analysis, we seek to evaluate if this recent price fluctuation has had any profound effects on miners’ selling behavior.
The miner reserve metric in the graph below, with a 30-day moving average for clear visualization, measures the volume of Bitcoin that miners hold onto. Interestingly, it seems that over the past few months, miners have halted selling and instead have been amassing Bitcoin at a phenomenal rate.
This suggests that miners, being a crucial group within the Bitcoin network, display optimism about future price actions and feel no immediate compulsion to sell their coins to cover operational costs. The subsequent decrease in the available Bitcoin could work in favor of the market in the longer run. The scenario of a new bull market coming to fruition might become a reality if sufficient buying demand enters the system.