BNB Price Analysis: Binance Coin Price Attempts Recovery
BNB price, which stands for Binance coin, has started a recovery after a dramatic fall. It had previously plunged to as low as $202 against the US Dollar. Going forward, if the price succeeds in breaking the crucial $215 resistance level, it is expected to experience a significant increase.
Key Developments in Binance Coin Price Movements
Let’s examine the critical highlights:
- Binance coin price has started a slow climb from the low points of $202 against the US Dollar.
- Currently, the price is hovering below $230 and 100 simple moving average recorded over four hours.
- BNB price managed to break above an essential bearish trend line that posed resistance near the $208. This development happened on the 4-hour chart of the BNB/USD pair (data source from Binance).
- With a successful move above $215 and $216, the BNB price could gather enough bullish momentum.
Binance Coin Price on Its Way to Fresh Increase?
In the recent past, the BNB price has experienced a significant fall from highs over the $235 level. This fall resulted in the price dropping below the $225 and $220 mark, leading the coin to enter a bearish zone, mimicking the price cycles of Bitcoin and Ethereum.
The price even hit below the $212 support level, causing concern among investors. The pressure eased a bit when it tested the $202 zone, which triggered an upside correction. A move above the $210 level followed, combined with a successful break above a key bearish trend line posing resistance around $208 on the 4-hour chart of the BNB/USD pair.
Despite these positive developments, the BNB price is still trading significantly below the $230 mark and the 100 simple moving average over four hours. On the upside, it faces resistance close to the $214 level. This level is also near the 23.6% Fib retracement level of the downward move from a swing high of $248 to a low of $203.
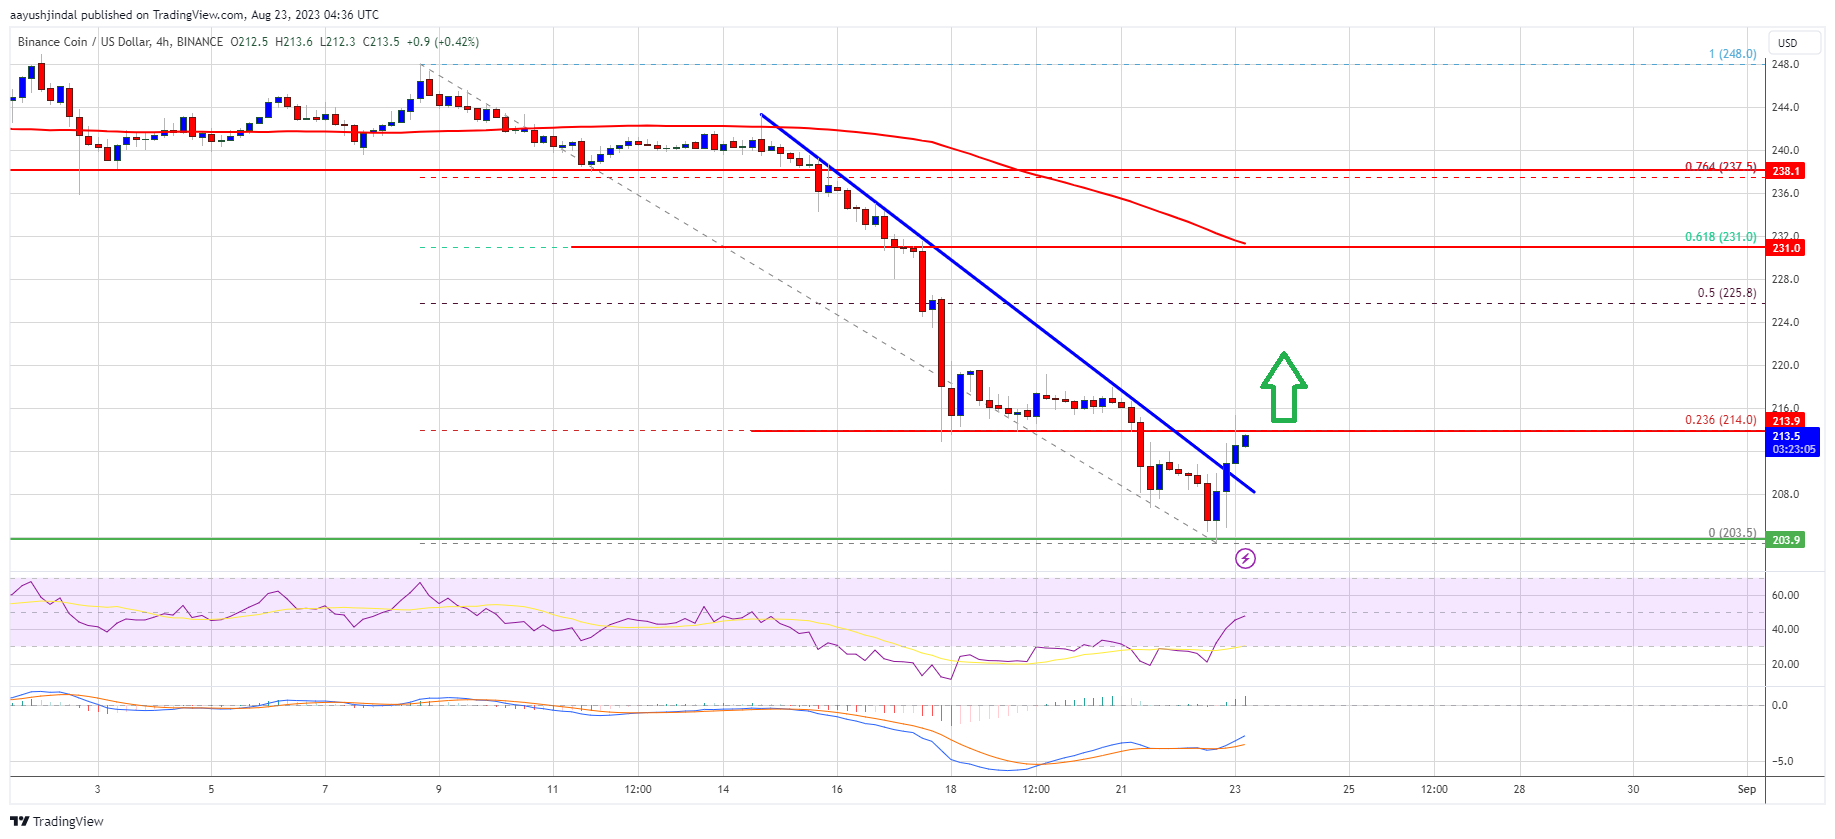
Source: BNBUSD on TradingView.com
Should the BNB price clear the $214 hurdle, it could rise even higher. The immediate significant resistance would then be near the $225 level which corresponds to the 50% Fib retracement of the downward move from the $248 swing high to the $203 swing low. A successful close above the $225 resistance might trigger a rally beyond the $230 resistance level.
Possibility of Another BNB Decline
If BNB fails to clear the $214 resistance, it risks another fall. The first support on the downside is close to $208. The subsequent major support is at the $202 level. If the BNB price breaks below the $202 support, it could dive towards the $200 support. Any further losses might push the price down to the $185 support level.
Technical Indicators
The technical indicators for BNB/USD provide insights into the potential future movements:
- 4-Hours MACD – The MACD for BNB/USD seems to be losing its momentum in the bearish zone.
- 4-Hours RSI (Relative Strength Index) – The RSI for BNB/USD is currently hovering near the middle mark of 50.
Important Price Levels
The critical price levels for BNB/USD are:
- Major Support Levels – $208, $202, and $200.
- Major Resistance Levels – $214, $225, and $230.