Yearn.finance (YFI) Market Overview and Technical Analysis
Yearn.finance, with its symbol (YFI), is among the leading cryptocurrencies in the digital asset market. This article delves into the recent price trends, market indicators and an in-depth technical analysis of YFI.
Market Snapshot
Here’s a brief look at some crucial data regarding the recent performance of YFI in the market:
-
Price: As of the recent report, YFI is being traded at an approximate value of $6855. This shows a price increase of 0.35% in the last 24 hours.
-
Weekly Performance: When calculated for the last seven days, YFI’s price has decreased by approximately -6.85%. This reveals a bearish trend during the past week.
-
Market Capitalization: The current market capitalization of Yearn.finance is nearly $226.351 Million. It is an essential metric that reflects the overall market value of YFI.
-
Trading Volume: The 24-hour trading volume of YFI is recorded to be approximately $14,363,508. This number represents a -3.40% decrease from the previous day, signifying a recent decline in the market activity concerning YFI.
Yearn.finance Trading Channel Pattern
At present, the price movement of Yearn.finance (YFI) is in a channel pattern. This pattern exhibits two significant barriers, namely, a trendline and the 50-day Exponential Moving Average (EMA). The next movement of YFI will largely depend on whether it can break out above these barriers or disrupt below the pattern.
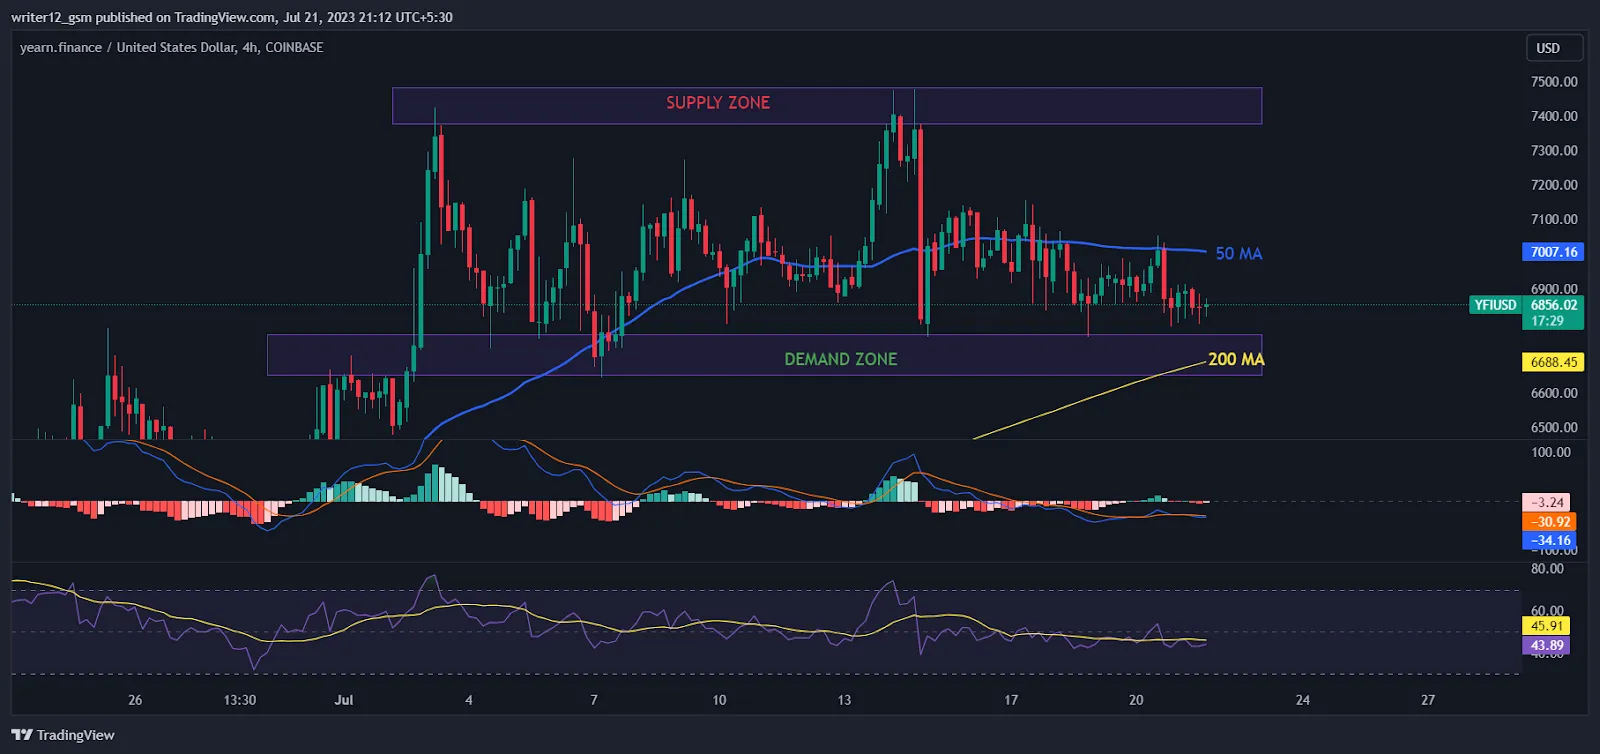
Source: YFI/US Dollar by TradingView
Highest Recorded Price
The all-time high price achieved by yearn.finance (YFI) is worth noting. It peaked at a value of $90,786.89 on May 12, 2021, about 2 years from the present. However, the existing price is -92.46% lower than the recorded maximum.
Current Market Sentiment
The current market sentiment for Yearn.finance (YFI) can be decidedly labelled as uncertain. There has been no significant surge or slump in volume concerning YFI. The price rebounded off the resistance line and is apparently finding support on the 50-moving average. This indicates an unpredictable tendency in the YFI market.
Yearn.finance Price Technical Analysis
In terms of a technical analysis, the Yearn.finance price appears to be suspended between the 50 and 200 Moving Averages (MAs) with a bullish crossover. This crossover displays the influence of buyers in the market. Yet, if the bears gain power and continue to pull the price down, YFI could potentially drop more and enter a bearish phase.
Key Indicators
Let’s have a look at what the significant indicators say about YFI:
-
Relative Strength Index (RSI): The current RSI stands at 43.89, close to the overbought zone. Also, the 14 SMA is 45.91 points higher. Such a situation may incite a surge in the price of YFI if it manages to escape from this channel pattern.
-
Moving Average Convergence Divergence (MACD): As per the MACD, the MACD line is -34.74, and the signal line is at -31.04. Both of these values stand above the zero line, suggesting that the MACD line is in the negative territory. This situation could be interpreted as a sign of a bearish trend.
Conclusion
Despite the prevailing uncertainty, both bears and bulls seem to be in a neck-to-neck battle over yearn.finance (YFI). The cryptocurrency is trying to break out of a descending pattern defined by a trendline and the 50-day MA as barriers. Under the current circumstances, traders and investors are recommended to remain patient and watch for a clear signal either below or above this range for their next action.
Key Support and Resistance Levels
- Support: The prevalent support level for YFI is $6500.23.
- Resistance: The current resistance level stands at $7130.00.
Disclaimer
This article and the analysis within is purely for educational and informational uses. Please refrain from using such details as financial, investment, or trading advice. Investing and trading in cryptocurrencies are considered risky. Always factor in your financial circumstances and risk profile before making any investment decisions.