In the world of cryptocurrency, the battle between bulls and bears continues to rage on. Recent data shows a 0.7% daily increase in the global market cap, bringing the total cryptocurrency market cap to $1.2 Trillion (T). The Fear and Greed Index, which measures market sentiment, currently sits at 55, indicating a balance between buyer and seller sentiment.
An In-depth Analysis of Bitcoin
Current Market Status
- Bitcoin (BTC) is currently experiencing a phase of bull activity.
- The Bitcoin-to-USD exchange rate has struggled to move above the $30,000 mark.
- Presently, BTC is trading at an average price of $29,800, with a minor daily gain of 0.19%.
- The weekly price decrease for Bitcoin stands at 1.4%.
- Trade volumes have dropped by 24% during the same period and currently stand at $10 Billion (B).
Technical Indicators
- The Bollinger Bands, a volatility indicator, show minimal divergence in recent trends, indicating relatively low volatility in Bitcoin’s price.
- The Relative Strength Index (RSI), a technical momentum indicator, is moving below its average level, reflecting the ongoing struggle between bulls and bears for market dominance.
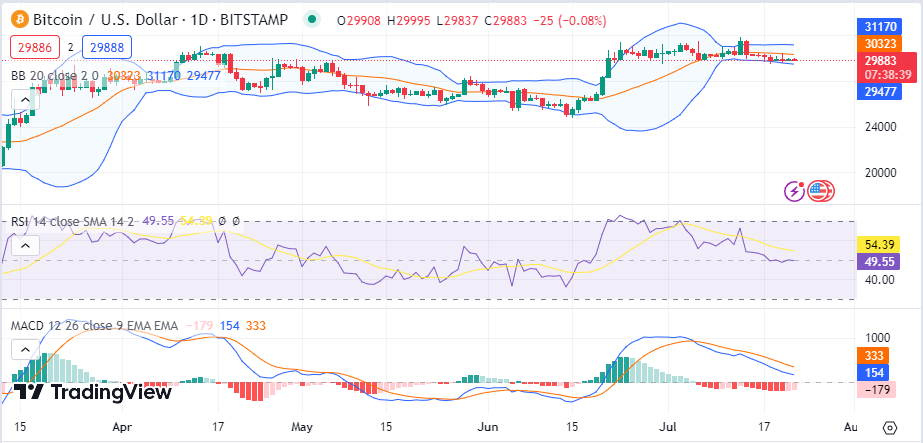
BTC 1-day chart | Source: TradingView
Ethereum’s Market Analysis
Current Market Status
- Ethereum (ETH) has started the week slow, but has recorded mild advances recently.
- The ETH/USD pair experienced a slight gain of 0.08%, with the price reaching $1888.
- The trading volume of Ethereum witnessed a decrease of about 28%, bringing it to $3.7B.
Technical Indicators
- Similarly, Bollinger Bands indicate low volatility levels for ETH as the bands remain closely placed.
- The RSI is moving below the average value, hinting at a possible bearish trend on Ethereum.
- An additional momentum indicator, MACD, is also shifting towards the negative region, suggesting attempts from bearish traders to overpower the market.
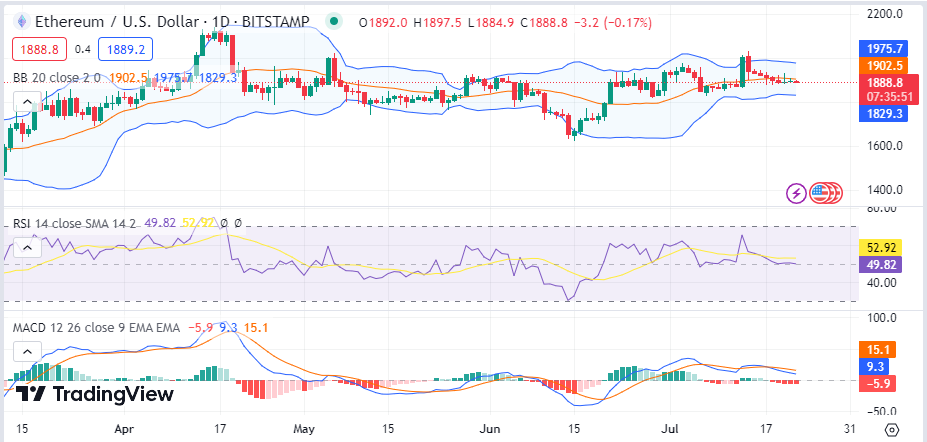
ETH 1-day chart | Source: Tradingview
Technical Analysis Ripple (XRP)
Current Market Status
- XRP appears to be trending downwards, with a rate decrease of 1% compared to the previous 24-hour cycle, bringing the price to approximately $0.766.
- XRP also experienced a significant increase in trading volume of 26%, reaching $1.4B.
Technical Indicators
- Ripple’s volatility levels remain high as the Bollinger Bands diverge, indicating increased volatility.
- The RSI is observed to be high in the overbought region, signaling bullish dominance.
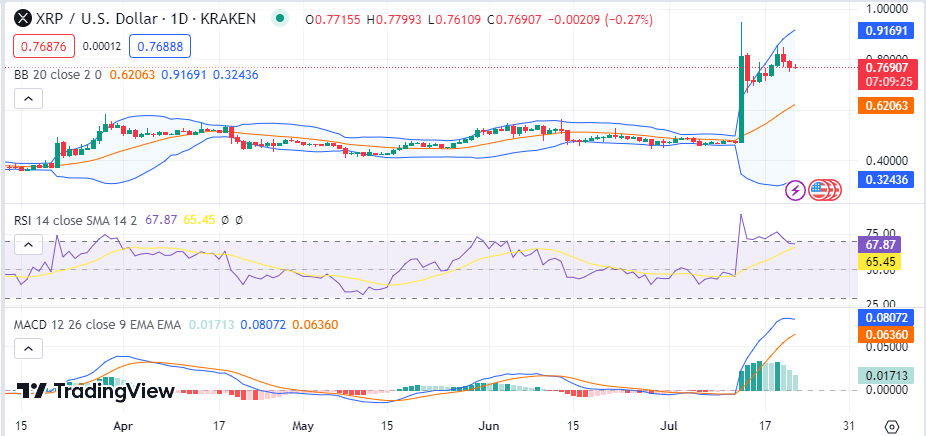
XRP 1-day chart | Source: Tradingview
Market Examination of XDC Network (XDC)
Current Market Status
- XDC has seen a significant surge of 35% in one session.
- The asset’s weekly gain stands at a staggering 67%, with its price at $0.05452.
- Trade volume is up by 68%, and the market volume has risen by 35%.
Technical Indicators
- The Bollinger Bands show an increasing divergence, implying rising volatility levels.
- The RSI is highly above its average level in the overbought regions.
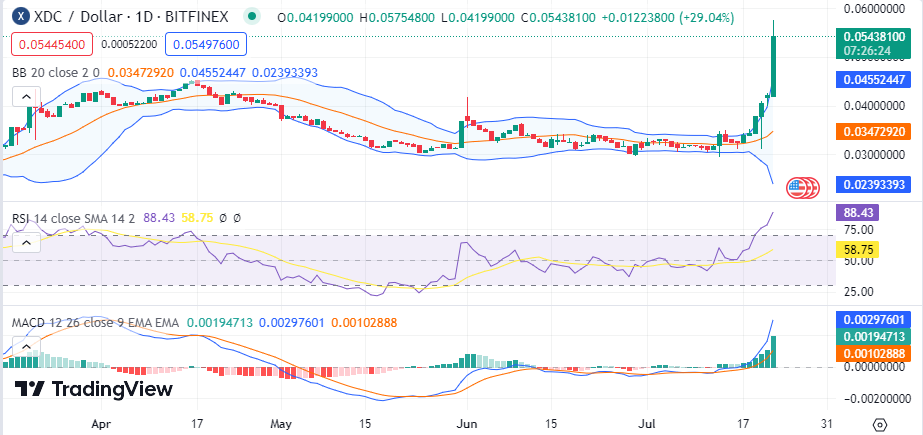
XDC 1-day chart | Source: Tradingview