Introduction
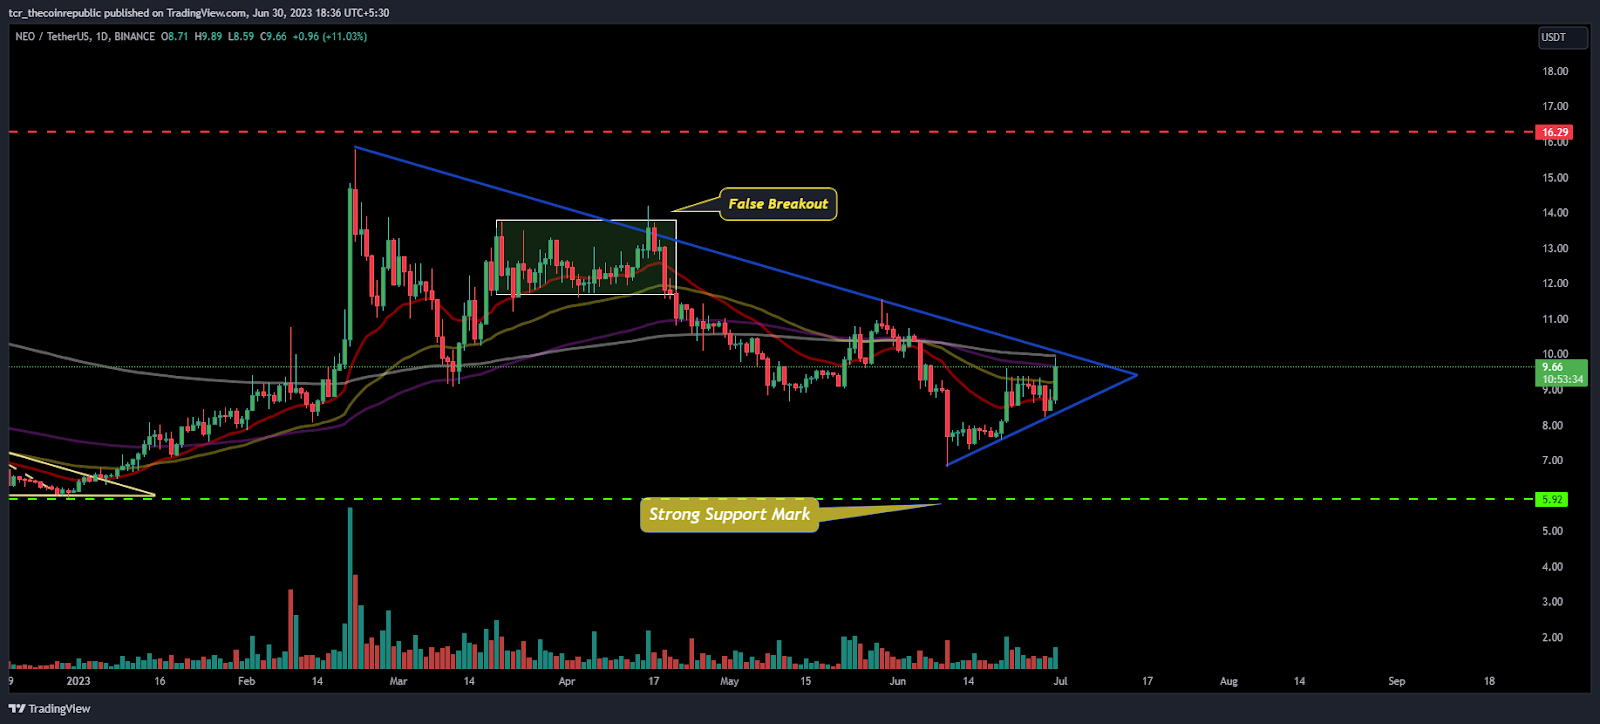
Recently, NEO coin price showcased an impressive gain by 10%, delineating massive bullishness. Demonstrating a bullish trend across the market, it significantly broke through various resistance parameters. Consequently, it has managed to rise above the key EMAs and is currently hovering near the 200-day EMA.
Key Points on NEO Coin Market Behavior:
- 1 NEO coin price escalated by 10% indicating strong bullishness.
- 2 The NEO coin price displayed bullish movements and efficiently broke multiple resistance levels.
- 3 A bullish marubozu candle emerged in the intraday session propelling upward growth.
- 4 NEO coin price is present above the key EMAs and is closing to the 200-day EMA.
Market Observations
1. Bulls appear willing to conquer the swing barrier attuned at $10. This boundary previously acted as a secure vault where sellers held dominance. Interestingly, the market is currently in an excited phase. If buyers manage to escape this range successfully, the rally is forecasted to prolong, and an extension of bullishness may be witnessed.
2. Reverse scenario posits that if the upcoming candle drops lower than the 50-day EMA, which is below $9.00, the price will once again step into the congestion area where it may continue to persist. At this juncture, the price action shows the bulls gaining traction with fresh long positions made by investors.
Current Market Status
Currently, the NEO coin price is being traded at $9.71, marking an intraday gain of about 10.30%. Furthermore, the intraday trading volume rose by 15.80% clocking at $119.86 Million. Additionally, NEO/BTC pair is trading at 0.000313 BTC with the market cap hitting $684.38 Million. These figures denote an amplification in sentiment in favor of NEO.
Daily Chart Indications
The daily charts suggest that NEO coin is experiencing high volatility with the bulls successfully defending the lower trendline and rebounding from recent trading sessions. This is illustrated by pulling back from the earlier trading sessions. On the contrary, the upper trendline continues to act as a hindrance. A successful break through this could pave the way for future trends.

Source: TradingView
Fibonacci Levels
As projected by the Fibonacci levels, the NEO coin situates near the 38.2% level existing approximately at $10.20. Buyers seem to be prepared to test this range in upcoming sessions. However, if the coin ascends above this range, it is expected to attain neutrality, which could potentially trap the sellers.
Short-Term Chart Analysis
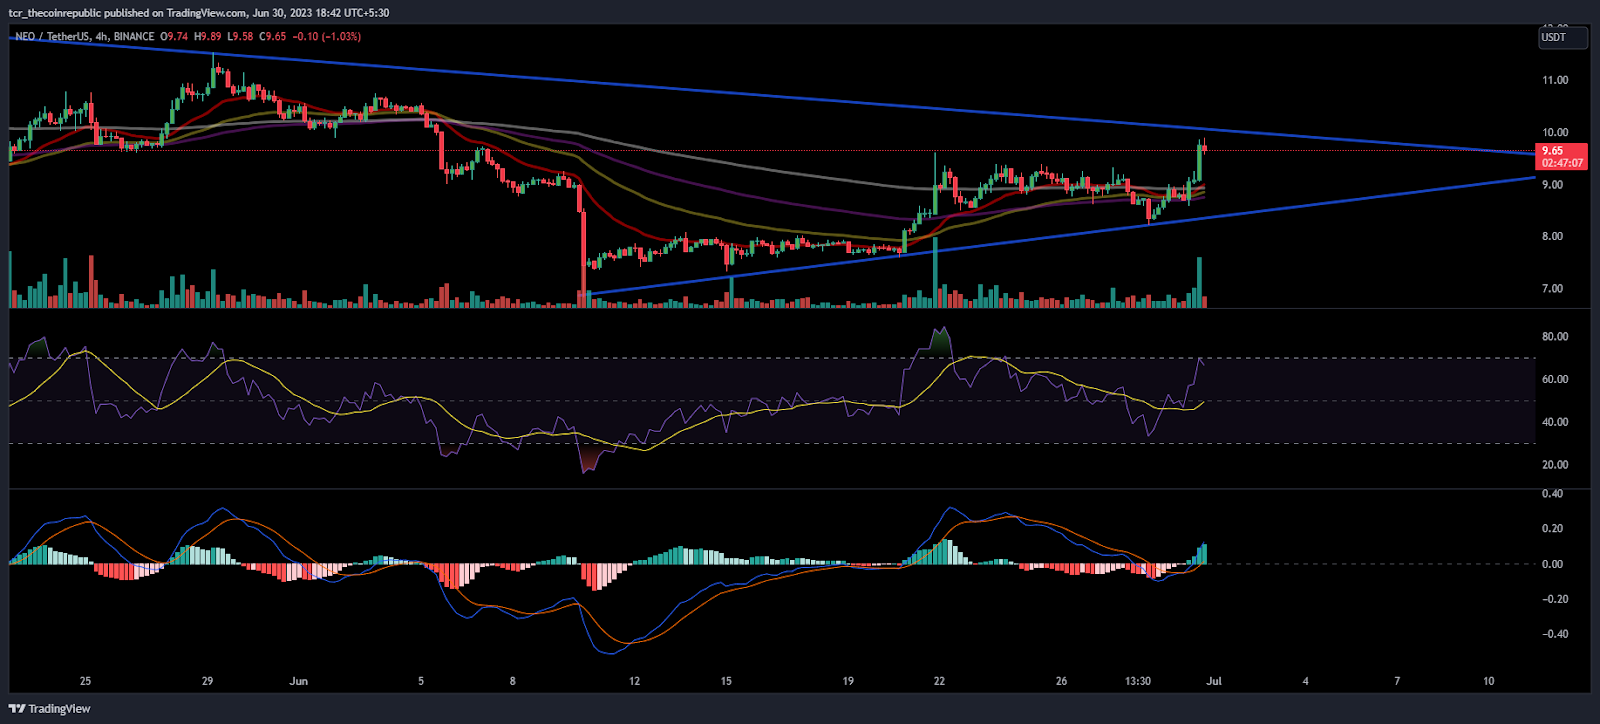
The 4-hour chart reveals a significant move displaying a break-out from the consolidation range compared to prior sessions. The voluminous presence of investors can be seen in these charts. In addition, a massive gain of 10% confirms the break-out from the consolidation zone and solidifies strong bullish interest.

Source: TradingView
Key Takeaways:
- 1 The short-term chart displays a range breakout.
- 2 RSI curve portrayed an impressive up-move, hovering in an overbought zone close to 70, and displayed positive divergence.
- 3 The MACD indicator also reflects similar sentiments, indicating positive outlook by plotting green bars on the histogram, showcasing a bullish crossover.
Conclusion
Currently, NEO coin price is striving to maintain its momentum and aims to sustain the gains above the 200-day EMA, which is now being viewed as a hurdle.
Technical Support and Resistance Levels
- Support Levels:$9.00
- Resistance Levels:$10 and $12
Disclaimer
The views expressed by the author, or any personnel mentioned in this article, are purely for informational purposes and do not constitute financial, investment, or other advice. Crypto assets investment and trading carry risk of financial loss.